 Permanecer
Condiciones de negociación
Products
Herramientas



The EUR/USD currency pair continued its weak downward move on Friday. The US inflation report, rightly considered the "report of the week," did not please traders with a resonant print but did trigger a sharp dollar sell-off in the second half of the day. However, the dollar's decline was short-lived. Although US inflation for August was unchanged, the market interpreted the event as increasing the likelihood of Federal Reserve tightening in September. Currently, the market expects a rate hike with nearly 90% probability. As we have said many times, we doubt this, but the dollar has risen in recent days largely on the basis of that expectation. This week, several interesting publications and events will be released in the US and the euro area, but the market will likely focus almost exclusively on one — the Fed meeting on Wednesday evening. Official forecasts now point to a key rate near 4%. Thus the dollar may continue to strengthen this week, even though the market has been waiting for Fed tightening all summer. If it is expected, the decision has likely been priced into the dollar for a long time.
Technically, the pair has settled below the Ichimoku indicator lines and the trend line. Thus, a new downtrend has begun on the hourly TF. The market once again ignored the ECB's "hawkish" decision and is pricing in an as-yet unmade "hawkish" Fed decision. In the short term, the dollar's prospects look more attractive than the euro's.
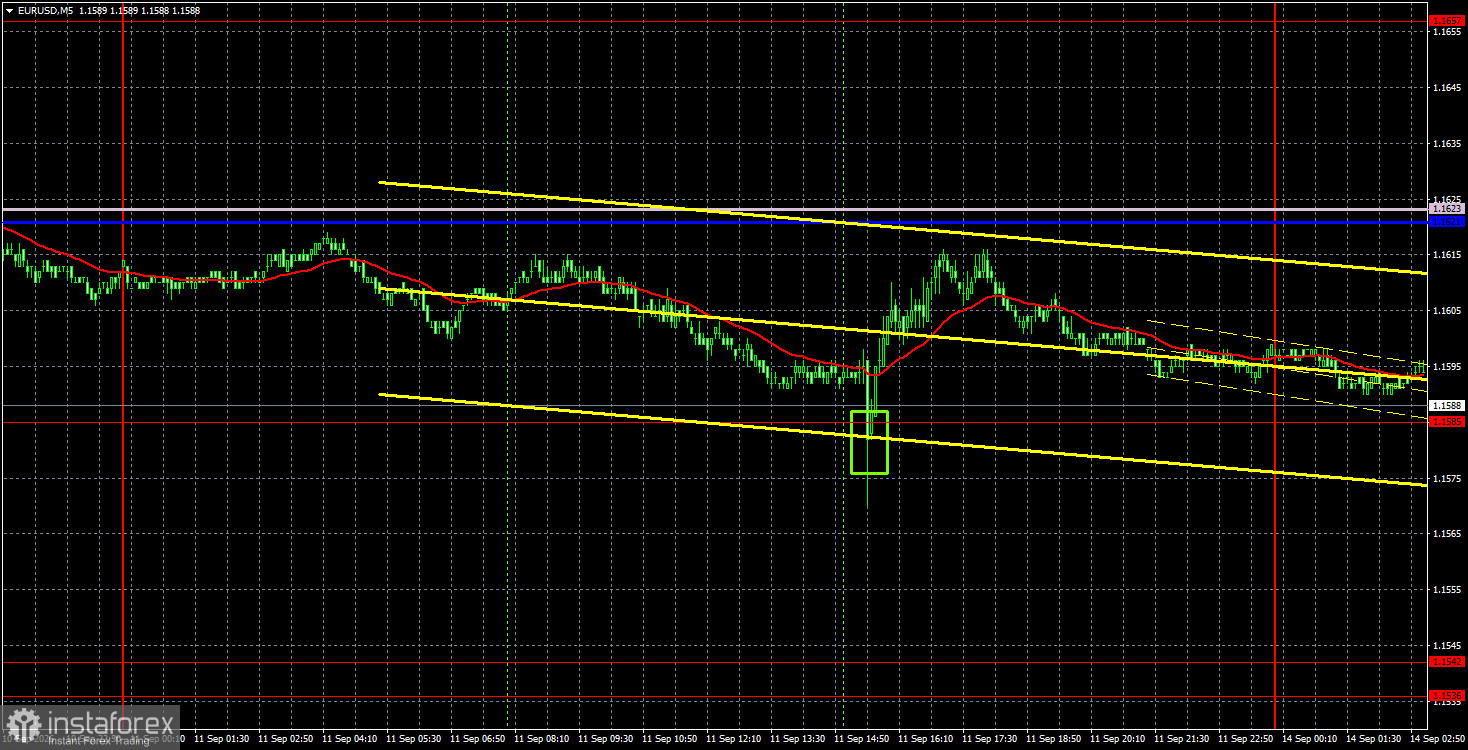
On the 5-minute TF on Friday, one buy trading signal was formed as a bounce from the 1.1585 level. The signal did not produce large profits because intraday volatility again left much to be desired.
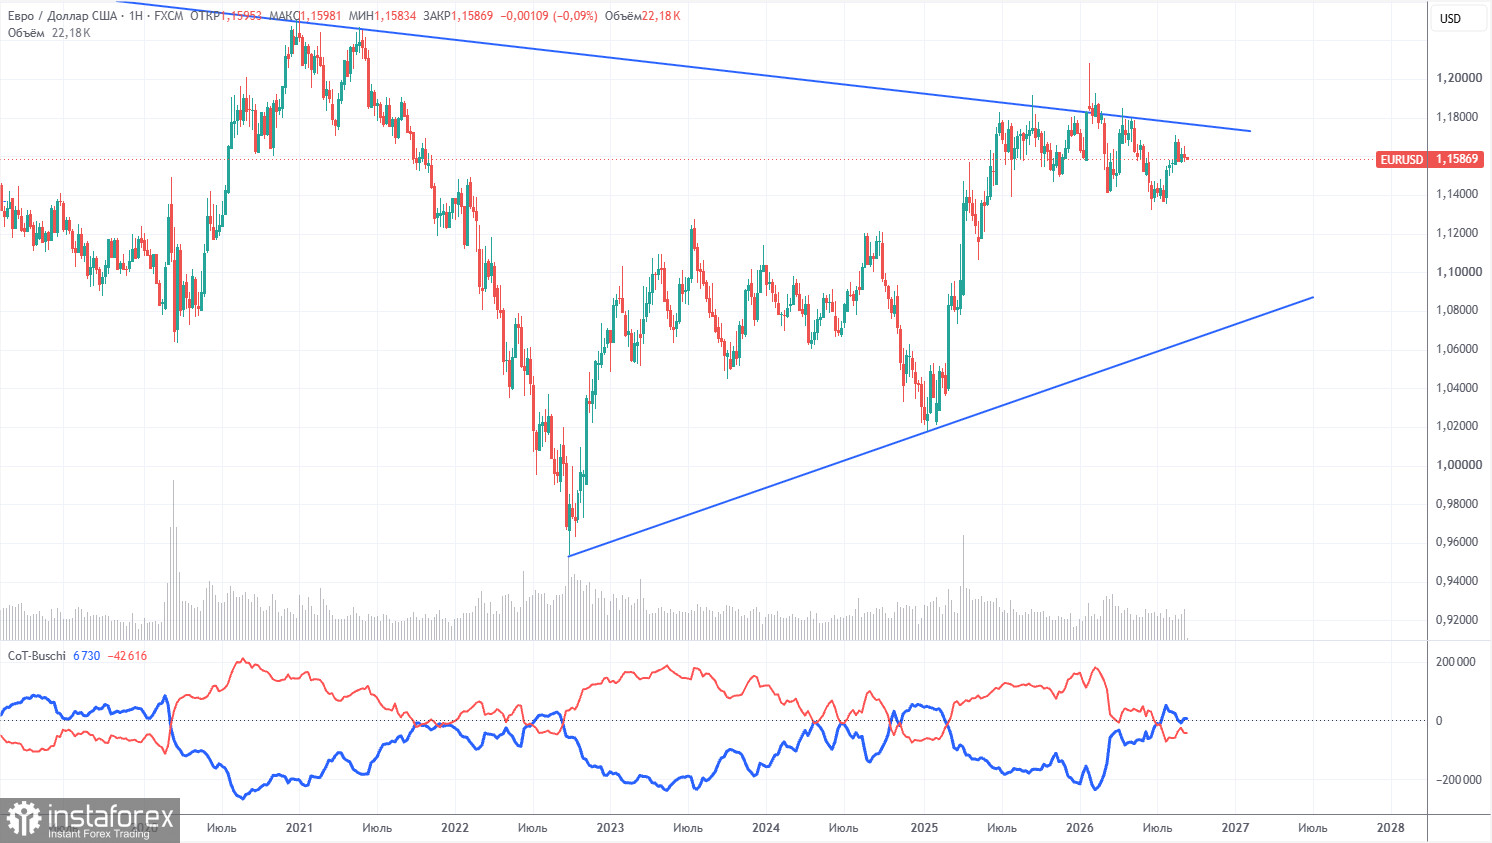
The latest COT report is dated September 8. On the weekly TF chart, it is clear that non-commercial traders' net position turned "bearish" and has significantly decreased in 2026 due to geopolitical events. Traders have been reducing euro holdings in favor of the US dollar during the past six months. Donald Trump's policy has not changed, but the dollar has long served as a "reserve currency."
However, we still do not see any fundamental factors for further strengthening of the US currency. The war in the Middle East made the dollar temporarily super-attractive, but when that factor's "shelf life" expires, everything will return to normal. And the shelf life may already have expired. In the long term, the euro could fall as low as $1.08 (trend line), but the uptrend will remain relevant. During the recent months of dollar strength, the pair has not approached that line closely.
The placement of the red and blue indicator lines indicates an approximate parity between bulls and bears. During the last reporting week, the number of longs in the "Non-commercial" group decreased by 5,000, while the number of shorts increased by 12,700. Accordingly, the net position fell by 17,700 contracts.
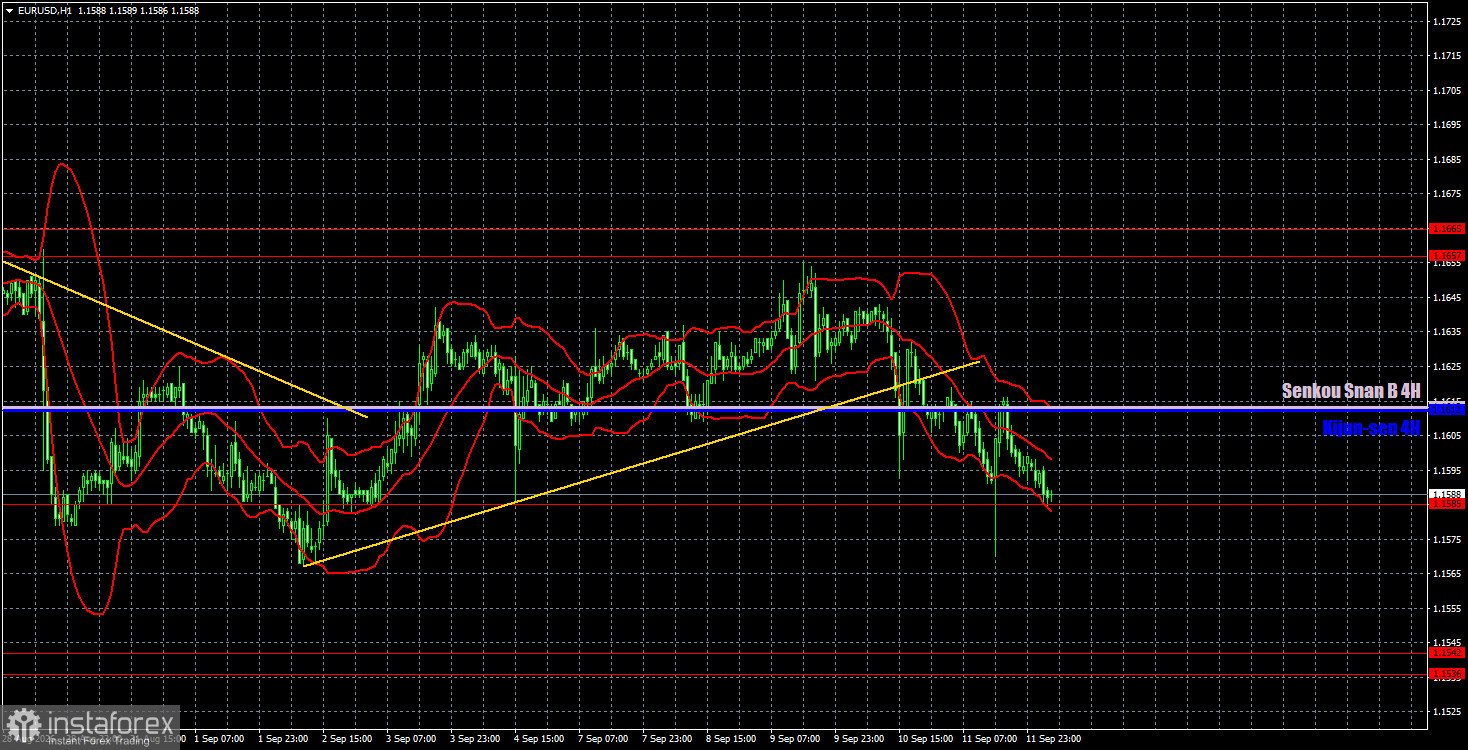
On the hourly timeframe, EUR/USD has turned down and begun a new downward trend. The ECB should have supported the euro, having raised rates for the second time in 2026, but the market now sees only the Fed and its policy tightening. Thus, the dollar can form a new trend out of thin air, but everything will now depend on the actual Fed decision.
For September 14 we highlight the following levels for trading — 1.1234, 1.1274, 1.1362–1.1368, 1.1461–1.1473, 1.1536–1.1542, 1.1585, 1.1657–1.1665, 1.1750–1.1760, 1.1786, 1.1830–1.1837, as well as the Senkou Span B line (1.1613) and the Kijun-sen (1.1613). The Ichimoku indicator lines may move during the day, so account for this when determining trading signals. Don't forget to move your Stop Loss to breakeven if the price has moved 15 pips in the correct direction. This will protect against possible losses if the signal turns out to be false.
On Monday, Christine Lagarde will give another speech in the euro area, but we do not expect fundamentally new or important information from the ECB chief. Last Thursday, Lagarde made it clear that inflation will continue to rise, so the ECB is ready to keep raising key rates further if needed.
Traders today may consider short positions targeting 1.1536–1.1542 if the price consolidates below 1.1585. A bounce from 1.1585 will allow opening long positions targeting the Senkou Span B line and 1.1657–1.1665. Volatility may again be weak today.
Support and resistance price levels are thick red lines where movement may conclude. They are not sources of trading signals.
The Kijun-sen and Senkou Span B lines are Ichimoku indicator lines transferred to the hourly timeframe from the 4-hour timeframe. They are strong lines.
Extreme levels are thin red lines from which the price has previously rebounded. They are sources of trading signals.
Yellow lines indicate trend lines, trending channels, and any other technical patterns.
Indicator 1 on COT charts shows the size of the net position of each category of traders.
¡Los informes analíticos de InstaForex lo mantendrá bien informado de las tendencias del mercado! Al ser un cliente de InstaForex, se le proporciona una gran cantidad de servicios gratuitos para una operación eficiente.


