 Permanecer
Condiciones de negociación
Products
Herramientas



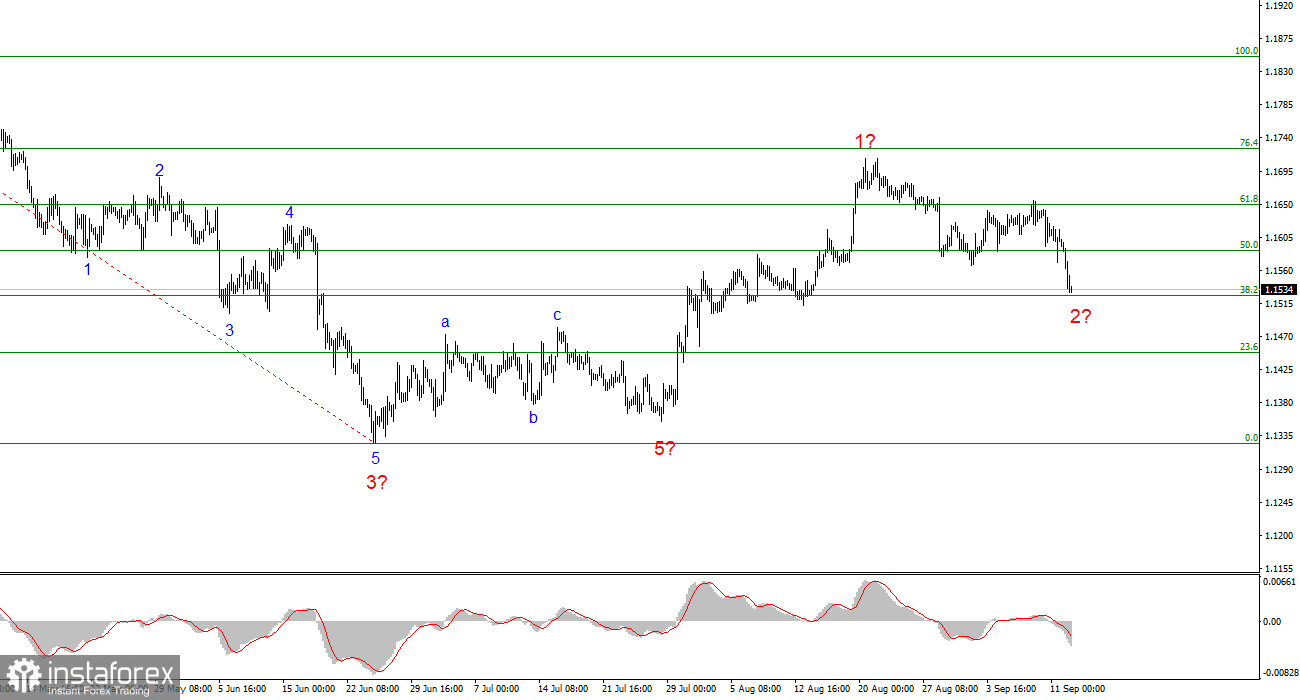
The Elliott Wave structure of the four-hour EUR/USD chart is becoming more complex. There is still no question of invalidating the bullish trend segment (lower chart), which began in January of last year. On the contrary, we have seen a complete A-B-C corrective structure, which has most likely been completed. We never saw a convincing Wave 5 within Wave C. This wave took a truncated form, which also occurs from time to time. Let me remind you that classical wave structures are generally found only in textbooks. In real-world trading, traders and analysts need to be more flexible in their analysis.
The wave structure may once again develop into a more complex pattern. Wave C may take a three-wave form, with the following wave identified as Wave D, while the entire trend segment that began on January 27 would take the five-wave corrective form A-B-C-D-E. If this assumption is correct, Wave D will take a three-wave form, and on August 21, EUR/USD entered the phase of developing Wave E, whose low should be below the low of Wave C at 1.1325. At the same time, however, this is an alternative scenario. Based on the news background, I am more inclined to expect the development of a global bullish wave and trend segment.
The EUR/USD pair fell by 60 points during Monday's trading session, which can be described as a record level of market activity in recent weeks. Interestingly, there was virtually no significant news background today, apart from Christine Lagarde's speech. However, this event was not expected to attract much interest for several reasons.
First, the ECB held its meeting last week and raised all three interest rates, an event that the market did not price in at all. For comparison, consider how the market is preparing for the Fed meeting on Monday and how it prepared for the ECB meeting. The difference is obvious, even though there was absolutely no doubt that the European central bank would tighten monetary policy.
Second, the market received all the necessary information about the ECB's future plans last week. Therefore, Monday's decline in the European currency was not related to the ECB president's speech.
There is only one explanation left. On Friday, the inflation report showed that US inflation remained at 3.4% year over year, which the market interpreted as a green light for monetary policy tightening this Wednesday. I do not know what explains such strong market optimism regarding the Fed's hawkish stance, but it is impossible to ignore the traders' almost complete confidence that the interest rate will be raised on Wednesday evening.
Accordingly, the future FOMC rate hike can be considered the main and only reason for the dollar's strengthening. If this assumption is correct, what should we expect on Wednesday evening if the Fed actually raises the rate? It appears that the US currency may decline. After all, the market has already priced in the policy-tightening factor.
Based on my analysis of EUR/USD, I conclude that the pair remains within a local bullish trend segment. It should be noted that the trend segment that began in January of this year may still develop into an A-B-C-D-E structure. If this assumption is correct, the decline in quotes will resume, with targets below the low of Wave C at 1.1325. However, I currently regard this scenario as an alternative one. I believe that a new bullish trend segment began developing in June, which will bring the euro back to the 20th figure and carry it significantly above that level. Consequently, I continue to favor long positions, with targets above the 17th figure.
On the higher time frame, a bullish trend segment is visible, followed by the formation of an A-B-C corrective structure. This structure could develop into a five-wave pattern, but at the present time I consider it complete. If that is the case, a new impulsive bullish trend segment has begun to develop.
¡Los informes analíticos de InstaForex lo mantendrá bien informado de las tendencias del mercado! Al ser un cliente de InstaForex, se le proporciona una gran cantidad de servicios gratuitos para una operación eficiente.


