 Permanecer

Condiciones de negociación
Products
Herramientas


Bitcoin pierced $87,000 after Donald Trump at the last moment called off a prepared strike on Houthi positions in Yemen, and the Houthis, through political bureau representative Mohammed al-Bukhaiti, pledged not to attack US vessels in the Red Sea. The market immediately priced in the sharp drop in the risk of a new escalation in the Middle East.

The causal chain centers on how close the market had come to a fresh wave of military escalation just a day earlier. According to The New York Times and Axios, the US administration had been preparing a strike — bombs were loaded onto aircraft — and Trump decided to cancel at the last minute after calls from Saudi Crown Prince Mohammed bin Salman, who had been pressing for US military action against the Houthis advancing toward the strategically vital Bab al-Mandeb strait. Apparently, the US president did not want to open a second front of tension in the strait while the Strait of Hormuz was already effectively blocked, since that risked another jump in oil prices at a moment when Saudi Arabia itself was expected to bear the brunt of containing the Houthis.
That crossroads — between full US military engagement and diplomatic settlement via intermediaries — determined the market's direction. The decision not to strike signaled that the base case had shifted toward de?escalation rather than an expanded conflict, triggering a rapid short squeeze: shorts opened on the expectation of the opposite outcome were violently closed. The main beneficiaries were holders of long positions in Bitcoin and Ether, while short sellers betting on continued geopolitical tension bore the brunt of cascade liquidations.
I believe the durability of this move will depend directly on whether the Houthis honor their promise not to attack US vessels, since the group simultaneously says it will continue strikes on Saudi targets until blockades of its controlled territories are lifted — meaning a full settlement has not been reached, only one of the most dangerous scenarios has been averted. Traders' attention will also focus on President Trump's speech at the UN General Assembly in New York later on Tuesday: the market is watching whether he meets his Iranian counterpart Masoud Pezeshkian, a meeting that could be a turning point for oil prices.
Technical analysis
Bitcoin
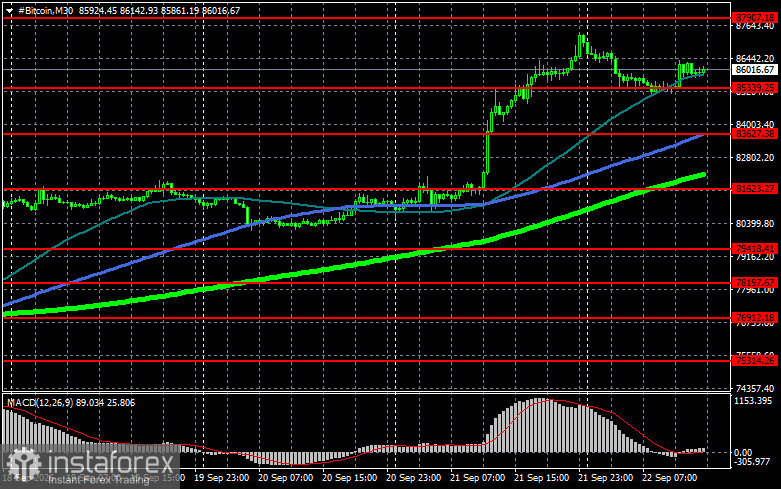
Buyers are now aiming to reclaim $87,900, which would open a straight path to $90,000 and then to $92,100 — a breach of which would signal attempts to restore a bull market. On the downside, buyers may step in at $85,300; a drop below that level could quickly push BTC toward $83,600. The next extended target on the downside is $81,600.
Technical analysis
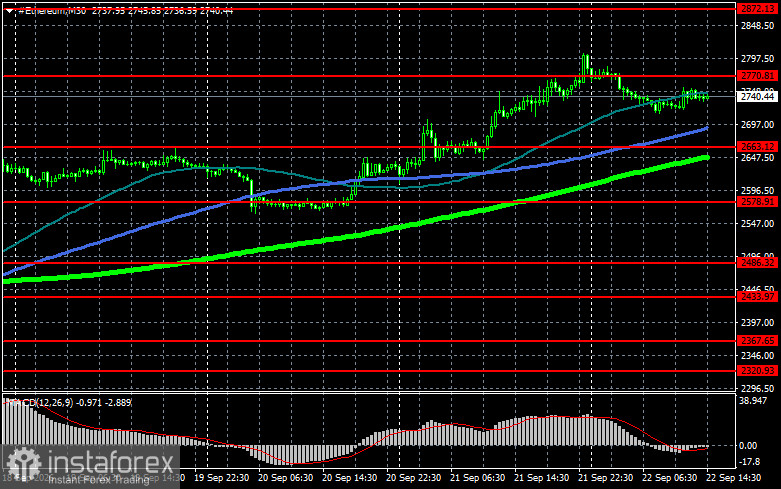
Ethereum: A clear hold above $2,770 opens the way to $2,872, with a further target at around $2,920 — a break above which would reinforce bullish market sentiment and revive buyer interest. On the downside, support is expected at $2,660; a return below that level could quickly send ETH toward $2,570, with a further downside target near $2,486.
What's on the chart
Price testing or crossing any of these moving averages often either halts movement or injects fresh momentum into the market.
¡Los informes analíticos de InstaForex lo mantendrá bien informado de las tendencias del mercado! Al ser un cliente de InstaForex, se le proporciona una gran cantidad de servicios gratuitos para una operación eficiente.


