 Permanecer

Condiciones de negociación
Products
Herramientas


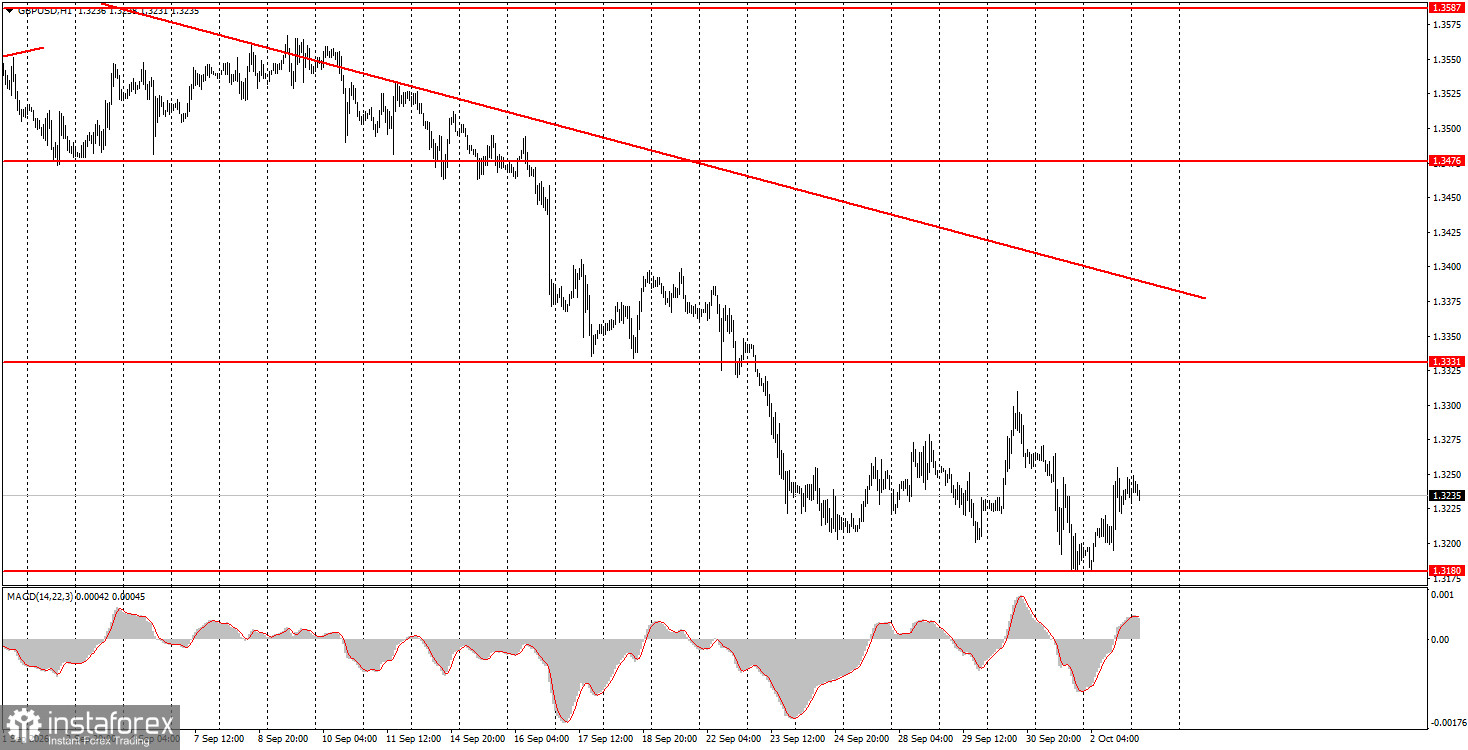
The GBP/USD pair showed a modest rise on Friday, which does not correspond to the macroeconomic backdrop and the events of the day, week, or even the past month. On Friday, the US released poor Nonfarm Payrolls and unemployment figures that contained nothing positive. Since these reports directly influence Federal Reserve policy, they cannot be called secondary. The readings were striking: the market did not expect a rise in unemployment and had looked for 90k new jobs but got 29k and a 30k downward revision to the prior month. We should have seen a large dollar drop and a sharp surge in GBP/USD. But as we have said many times, the market continues to buy the US dollar almost every day and ignores factors that argue against it. The downtrend has persisted for nearly a month. The dollar rises on any news.
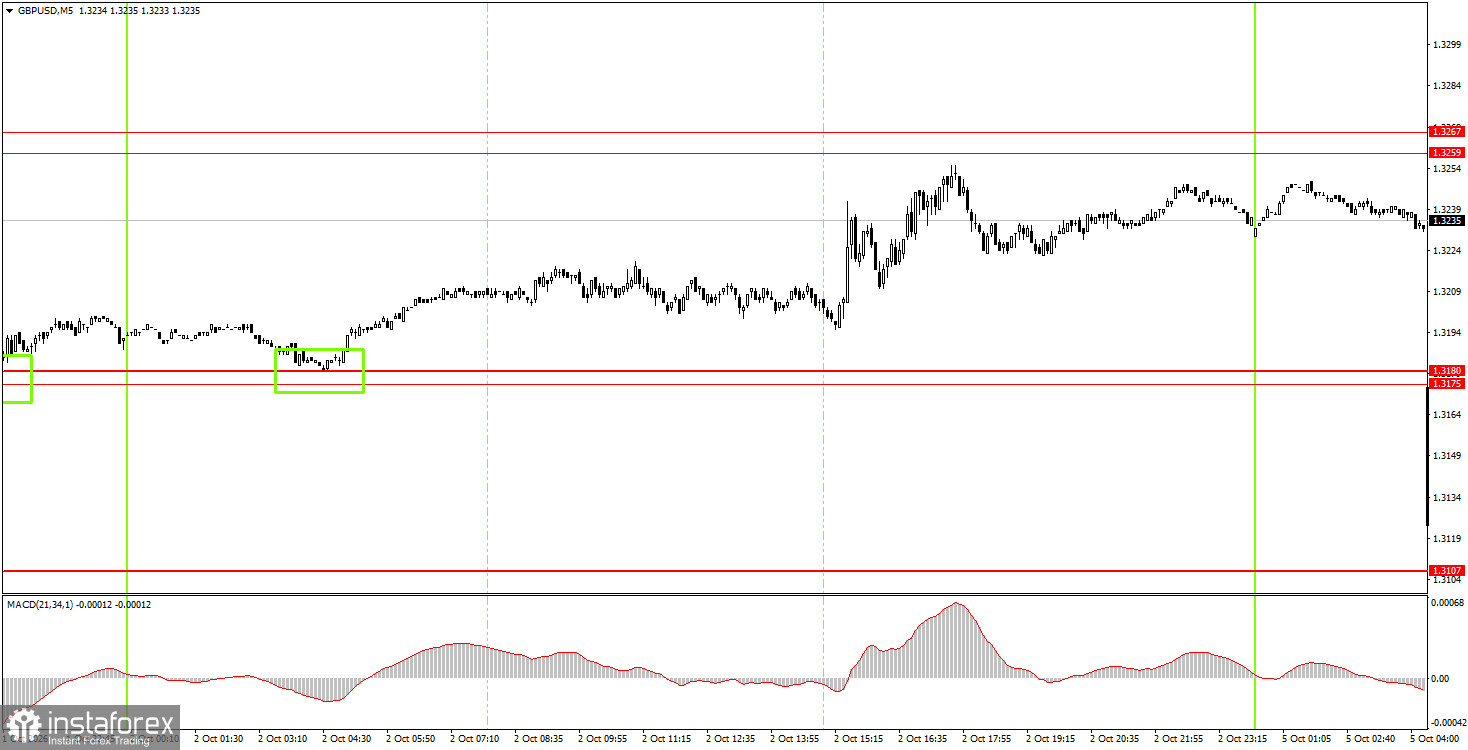
On the 5-minute TF on Friday, one very good buy signal was formed. During the Asian session, the price bounced from the 1.3175–1.3180 area and then spent most of the day moving upward. In the American session, the 1.3259–1.3267 area was almost reached, where traders could take profit on longs.
On the hourly TF, GBP/USD continues a downward trend that has become a full-fledged, powerful move. The fundamental backdrop for the dollar improved because the Fed indicated it was ready to continue tightening monetary policy. However, two and a half weeks have passed since then, and the market still buys the dollar aggressively. Therefore, we strongly doubt that Fed policy alone explains this. We consider the current movement completely illogical.
On Monday, novice traders can consider short positions with targets of 1.3175–1.3180 if the price rebounds from the 1.3259–1.3267 area. Open long positions with targets of 1.3319–1.3331 if price consolidates above 1.3259–1.3267.
On the 5-minute TF you can trade the levels 1.3043, 1.3096–1.3107, 1.3175–1.3180, 1.3259–1.3267, 1.3319–1.3331, 1.3380–1.3386, 1.3456–1.3476, 1.3587–1.3598, 1.3631–1.3641. No important events are scheduled in the UK on Monday, while the US will release the ISM services index. However, we see little point in that report since the market largely refuses to sell the dollar.
Price levels (areas) of support and resistance serve as targets for opening buy or sell trades or as sources of signals.
Red lines indicate channels or trend lines that show the current trend and the preferred trading direction.
The MACD indicator (14,22,3) — the histogram and signal line — is an auxiliary indicator that can also provide signals.
Important speeches and reports (listed in the news calendar) can significantly influence currency pair movements. Therefore, during their release, traders should approach trading with utmost caution, or exit the market to avoid sudden reversals against the preceding move.
Beginner forex traders should remember that not every trade can be profitable. Developing a clear strategy and practicing money management are key to long-term success in trading.
¡Los informes analíticos de InstaForex lo mantendrá bien informado de las tendencias del mercado! Al ser un cliente de InstaForex, se le proporciona una gran cantidad de servicios gratuitos para una operación eficiente.


