 Permanecer
Condiciones de negociación
Products
Herramientas


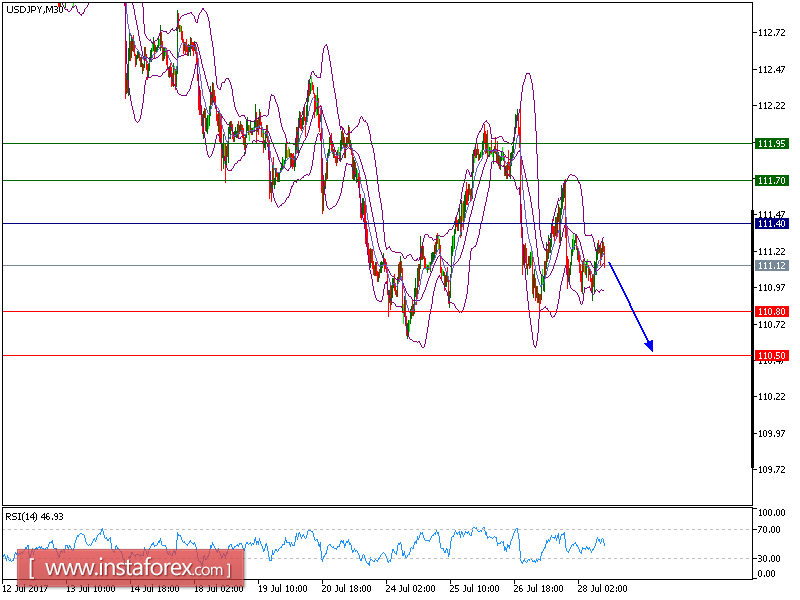
USD/JPY is expected to trade with a bullish outlook. The pair is trading below its declining 20-period and 50-period moving averages, which play resistance roles and maintain the upside bias. The relative strength index is mixed with a bearish bias. The upward potential is likely to be limited by the resistance at 111.40.
Therefore, as long as this key level is not surpassed, look for a further decline to 110.80 and even to 110.50 in extension.
Alternatively, if the price moves in the opposite direction, a long position is recommended above 111.40 with a target at 111.70.
Chart Explanation: The black line shows the pivot point. The current price above the pivot point indicates a bullish position while the price below the pivot point is a signal for a short position. The red lines show the support levels and the green line indicates the resistance level. These levels can be used to enter and exit trades.
Strategy: SELL, Stop Loss: 111.40, Take Profit: 111.95
Resistance levels: 110.80, 110.0, and 109.45 Support Levels: 111.70, 111.95, 112.35
¡Los informes analíticos de InstaForex lo mantendrá bien informado de las tendencias del mercado! Al ser un cliente de InstaForex, se le proporciona una gran cantidad de servicios gratuitos para una operación eficiente.


