 Rimani
Condizioni di trading
Strumenti


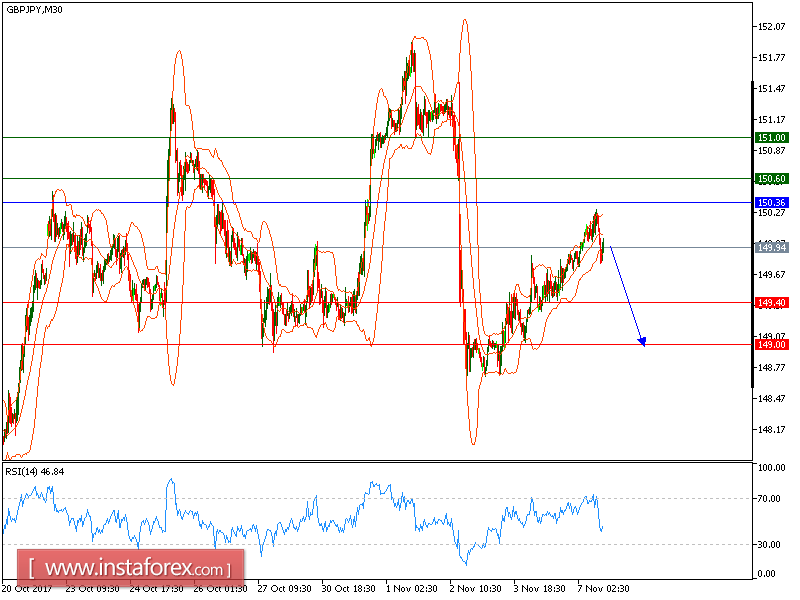
NZD/USD is expected to trade with a bearish outlook. The pair recently extended its decline and rebounded around 148.75, and is likely to gain the support level at 149.40. The risk of a slide below this threshold remains high, as the 20-period and 50-period moving averages are heading downward, and should continue to push the prices lower. In addition, the relative strength index is below its neutrality area at 50. Therefore, even though a technical rebound cannot be ruled out at the current stage, its extent should be limited.
As long as 150.35 is not surpassed, look for a new pullback to 149.40 and 149 in extension.
Alternatively, if the price moves in the direction opposite to the forecast, a short position is recommended below 150.35 with the target at 151.60.
Strategy: SELL, Stop Loss: 150.35, Take Profit: 149.40
Chart Explanation: the black line shows the pivot point. The price above the pivot point indicates long positions; and when it is below the pivot points, it indicates short positions. The red lines show the support levels and the green line indicates the resistance levels. These levels can be used to enter and exit trades.
Resistance levels: 150.60, 151.00 and 151.55
Support levels: 149.40, 149.00, and 148.35
Le recensioni analitiche di InstaForex ti renderanno pienamente consapevole delle tendenze del mercato! Essendo un cliente InstaForex, ti viene fornito un gran numero di servizi gratuiti per il trading efficiente.


