 Rimani
Condizioni di trading
Strumenti


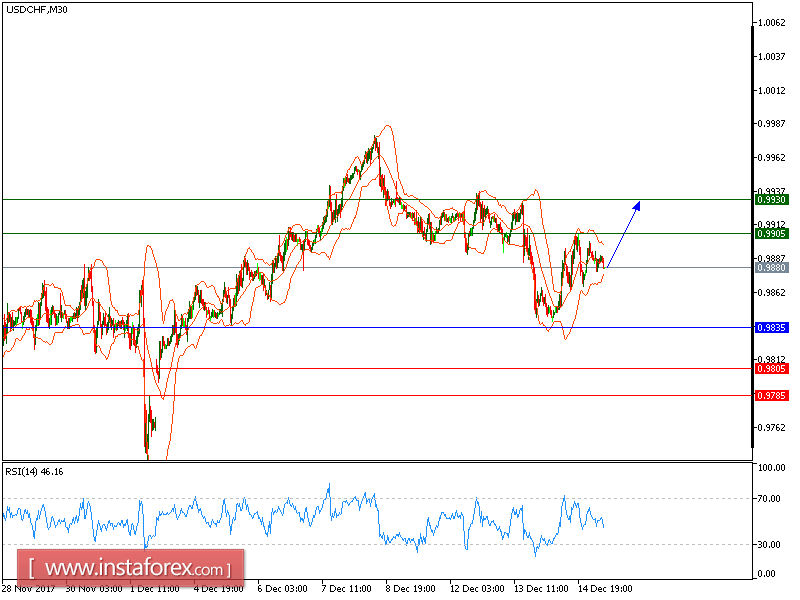
USD/CHF is expected to trade with a bullish outlook. The pair posted a rebound after touching the 50-period moving average. In addition, the 50-period moving average is turning up. The relative strength index lacks downward momentum. The downside potential should be limited by the key support at 0.9835.
The U.S. Commerce Department reported that retail sales grew 0.8% on month in November, faster than +0.3% expected and +0.5% in October. The Labor Department said initial jobless claims dropped 11,000 to a seasonally adjusted 225,000 in the week ended December 9, lower than 235,000 new claims expected.
To sum up, as long as this key level holds on the downside, look for the continuation of the rebound to 0.9905 and even to 0.9930 in extension.
Chart Explanation: The black line shows the pivot point. The present price above the pivot point indicates a bullish position, and the price below the pivot points indicates a short position. The red lines show the support levels and the green line indicates the resistance levels. These levels can be used to enter and exit trades.
Strategy: BUY, Stop Loss: 0.9835, Take Profit: 0.9905
Resistance levels: 0.9905, 0.9930, and 0.9960
Support levels: 0.9805, 0.9785, and 0.9755
Le recensioni analitiche di InstaForex ti renderanno pienamente consapevole delle tendenze del mercato! Essendo un cliente InstaForex, ti viene fornito un gran numero di servizi gratuiti per il trading efficiente.


