 Rimani
Condizioni di trading
Strumenti


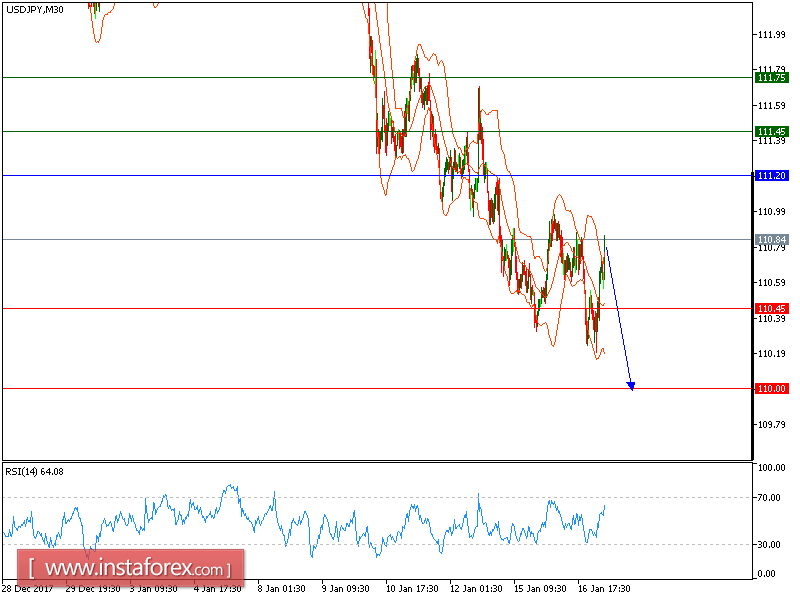
Our first downside target which we predicted in the previous analysis has been hit. The pair is capped by a declining trend line since Jan. 8, which confirmed a bearish outlook. The 20-period moving average is playing a resistance role. The relative strength index is also capped by a descending trend line since Jan. 16.
To sum up, below 111.20, look for a further drop with targets at 110.45 and 110.00 in extension.
Alternatively, if the price moves in the opposite direction, a long position is recommended above 111.20 with a target of 111.45.
Chart Explanation: The black line shows the pivot point. The current price above the pivot point indicates a bullish position, while the price below the pivot point is a signal for a short position. The red lines show the support levels and the green line indicates the resistance level. These levels can be used to enter and exit trades.
Strategy: SELL, stop loss at 111.20, take profit at 110.45.
Resistance levels: 111.45, 111.75, and 112.05
Support levels: 110.45, 110.00, and 109.65.
Le recensioni analitiche di InstaForex ti renderanno pienamente consapevole delle tendenze del mercato! Essendo un cliente InstaForex, ti viene fornito un gran numero di servizi gratuiti per il trading efficiente.

