 Rimani
Condizioni di trading
Strumenti


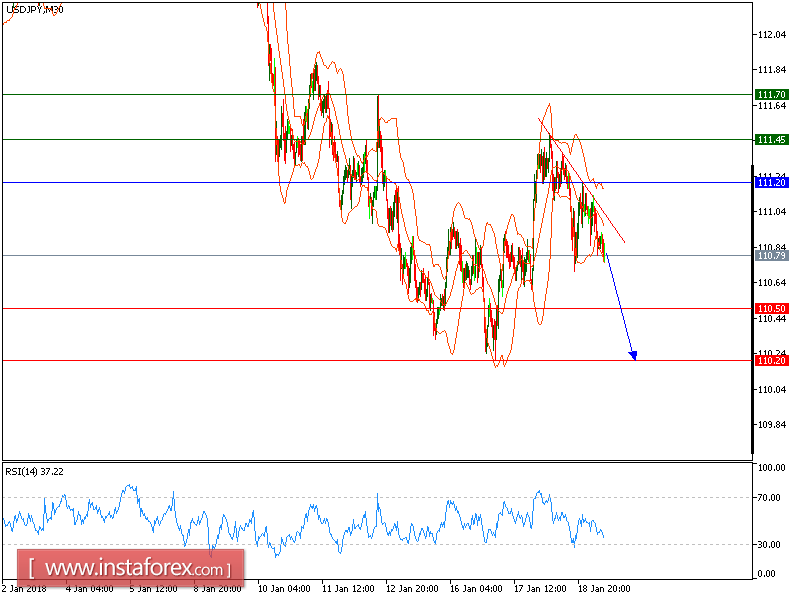
USD/JPY is under pressure. The pair retreated from 111.45 (the high of January 18) and recorded the process of lower tops and lower bottoms, which confirmed a negative outlook. The downward momentum is further reinforced by both declining 20-period and 50-period moving averages. The relative strength index is mixed to bearish.
Therefore, below 111.20, look for a new drop with targets at 110.50 and 110.20 in extension.
Alternatively, if the price moves in the opposite direction, a long position is recommended above 111.20 with a target of 111.45.
Chart Explanation: The black line shows the pivot point. The current price above the pivot point indicates a bullish position, while the price below the pivot point is a signal for a short position. The red lines show the support levels and the green line indicates the resistance level. These levels can be used to enter and exit trades.
Strategy: SELL, stop loss at 111.20, take profit at 110.50.
Resistance levels: 111.45, 111.70, and 112.05
Support levels: 110.50, 110.20, and 109.65.
Le recensioni analitiche di InstaForex ti renderanno pienamente consapevole delle tendenze del mercato! Essendo un cliente InstaForex, ti viene fornito un gran numero di servizi gratuiti per il trading efficiente.

