 Rimani
Condizioni di trading
Strumenti


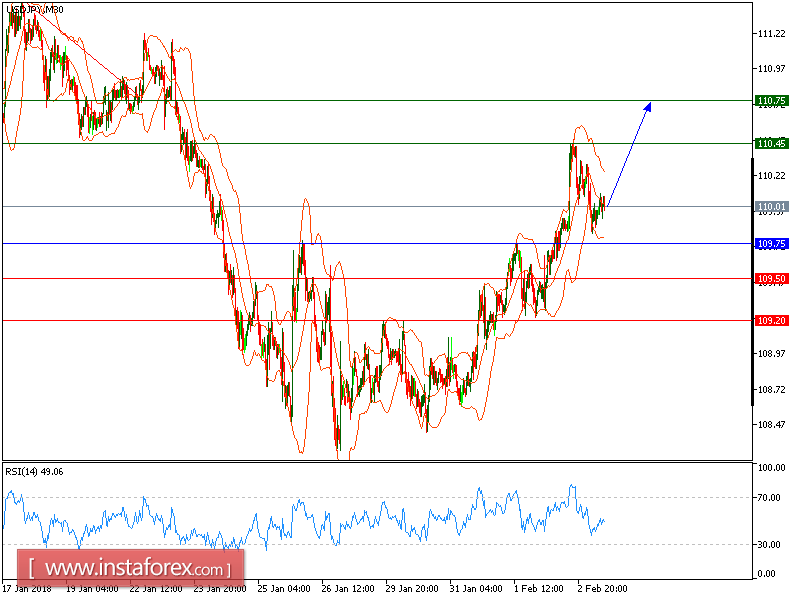
All our targets which we predicted in previous analysis have been hit. The pair is still expected to trade with a bullish outlook. The pair remains in a consolidation phase initiated at a high of 110.47 seen last Friday (February 2). Currently, it has crossed below the 20-period moving average while seeking support from the 50-period one. The relative strength index has lost the neutrality level of 50, indicating the possibility of an extension of the consolidation phase. In case the pair manages to emerge to the upside upon completing the consolidation phase, it is expected to return to 110.45 (around the high of Friday) and 110.75.
Therefore, as long as 109.20 is not broken, look for a further upside with targets at 110.10 and 110.35 in extension.
Alternatively, if the price moves in the opposite direction, a Short position is recommended to be below 109.75 with a target of 109.50.
Chart Explanation: The black line shows the pivot point. The current price above the pivot point indicates a bullish position, while the price below the pivot point is a signal for a short position. The red lines show the support levels, and the green line indicates the resistance level. These levels can be used to enter and exit trades.
Strategy: BUY, stop loss at 109.75, take profit at 110.45.
Resistance levels: 110.45, 110.75, and 111.00
Support levels: 109.50, 109.20, and 108.75.
Le recensioni analitiche di InstaForex ti renderanno pienamente consapevole delle tendenze del mercato! Essendo un cliente InstaForex, ti viene fornito un gran numero di servizi gratuiti per il trading efficiente.


