 Rimani
Condizioni di trading
Strumenti


Daily Outlook
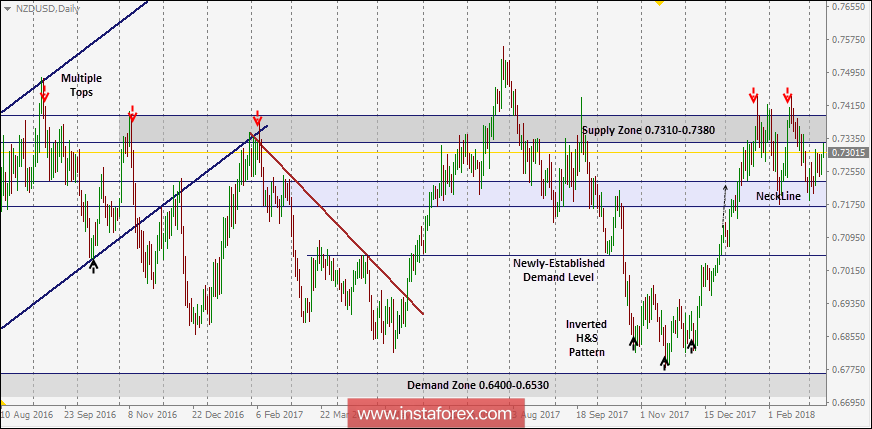
In July 2017, an atypical Head and Shoulders pattern was expressed on the depicted chart which indicated upcoming bearish reversal.
As expected, the price level of 0.7050 failed to offer enough bullish support for the NZD/USD pair. That's why, further bearish decline was expected towards 0.6800 (Reversal pattern bearish target).
Evident signs of bullish recovery was expressed around the depicted low (0.6780). An inverted Head and Shoulders pattern was expressed around these price levels.
The price zone of 0.7140-0.7250 (prominent Supply-Zone) failed to pause the ongoing bullish momentum. Instead, a bullish breakout above 0.7250 was expressed on January 11.
That's why, a quick bullish movement was expected towards the depicted supply zone (0.7320-0.7390) where evident bearish rejection and a valid SELL entry were expected.
On February 2, a bearish engulfing daily candlestick was expressed off the price level of 0.7390. Moreover, a double-top reversal pattern was expressed around the price zone (0.7320-0.7390).
The price zone (0.7320-0.7390) remains a significant supply zone for the NZD/USD pair. Any bullish pullback towards this price zone should be considered for a valid SELL entry.
On the other hand, bearish breakdown of 0.7300 (neckline) is needed to confirm the depicted reversal pattern. Bearish projection target would be located around 0.7050 and 0.7000.
Le recensioni analitiche di InstaForex ti renderanno pienamente consapevole delle tendenze del mercato! Essendo un cliente InstaForex, ti viene fornito un gran numero di servizi gratuiti per il trading efficiente.

