 Rimani
Condizioni di trading
Strumenti


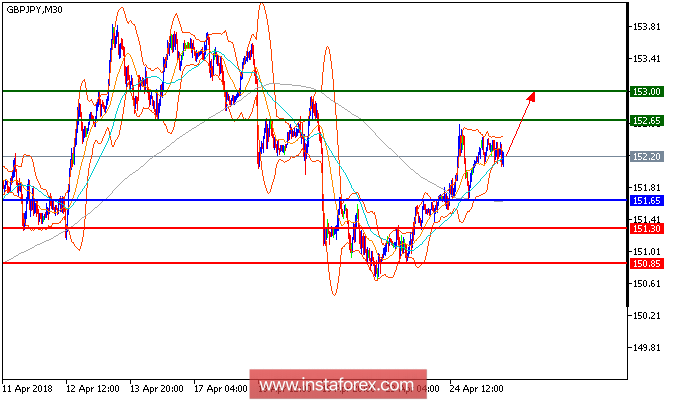
Our first upside targets which we predicted in yesterday's analysis has been hit. GBP/JPY is still on the upside and looking to post some further upside gains. The pair is posting some consolidations after the recent strong rebound but is still bullish above its horizontal support at 151.65. The relative strength index is mixed to bullish and calls for caution. In which case, as long as 151.65 holds on the downside, look for a limited consolidation before further advance to 152.65 and 153 in extension.
Fundamentally:
The British pound marked a day-low of US$1.3916, its lowest intraday level since March 19, before rebounding to close at US$1.3975, up 0.3% on the day and snapping a five-session losing streak. The currency was boosted by a revised 44 billion-pound bid by Japan's Takeda Pharmaceutical for London-listed drugmaker Shire.
Chart Explanation: The black line shows the pivot point. Currently, the price is above the pivot point which is a signal for long positions. If it remains below the pivot point, it will indicate short positions. The red lines show the support levels, while the green line indicates the resistance levels. These levels can be used to enter and exit trades.
Resistance levels: 152.65, 153.00, and 153.70
Support levels: 151.30, 150.85, and 150.
Le recensioni analitiche di InstaForex ti renderanno pienamente consapevole delle tendenze del mercato! Essendo un cliente InstaForex, ti viene fornito un gran numero di servizi gratuiti per il trading efficiente.


