 Rimani
Condizioni di trading
Strumenti


Today, we look at the weekly chart of EUR/USD. Why have we have been bullish about this pair?Pessimism was at its highest near 1.15-1.16 when everyone was talking about Italexit and expressed fears of the Eurozone break up.
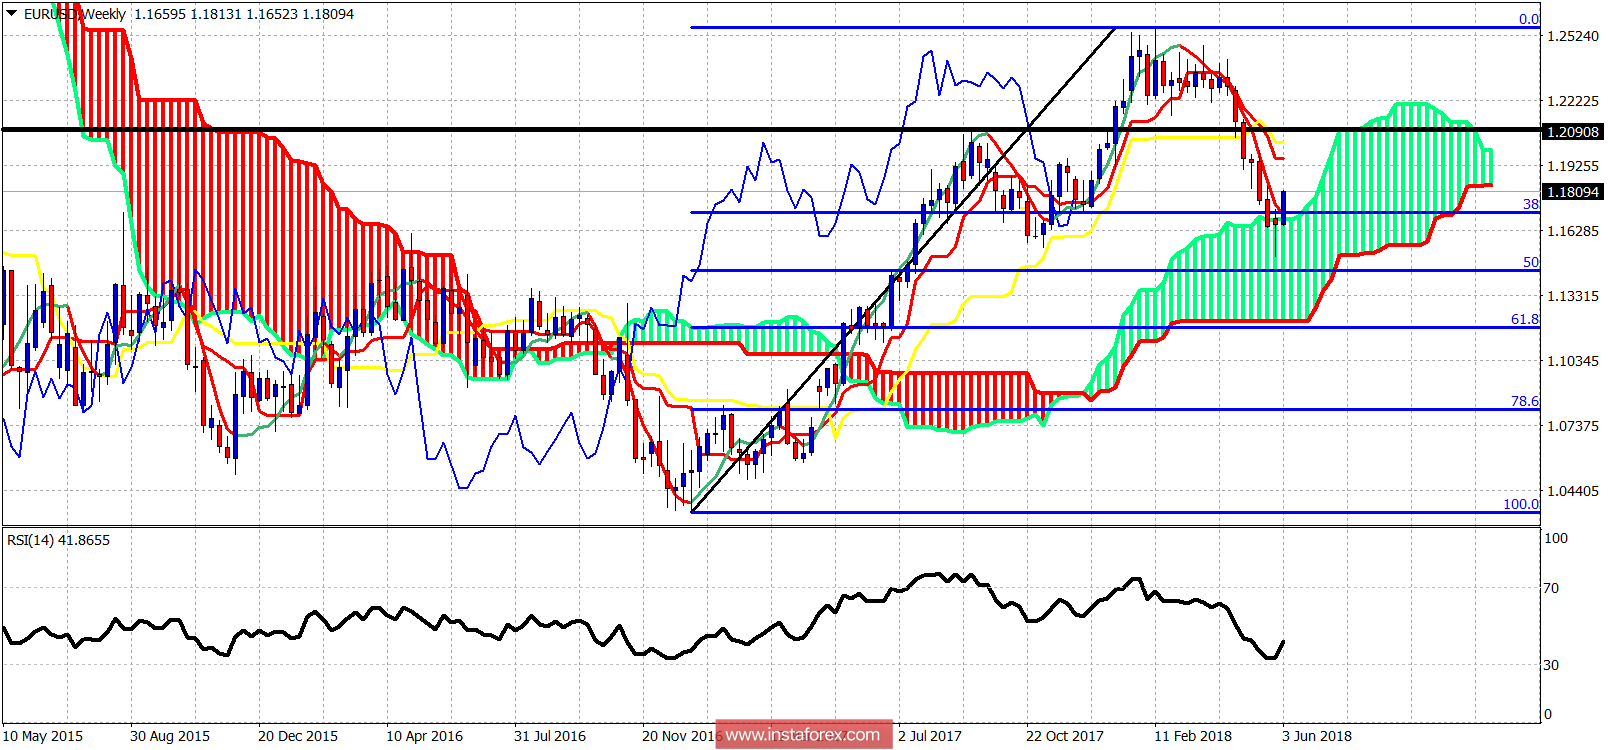
Black line - horizontal resistance
At market peaks and bottoms sentiment is at extremes. The same was the case when EUR/USD was trading around 1.15. On a weekly basis, we have two very bullish signs. First, last week's candle was a bullish hammer followed by a bullish week. Price bounced strongly off the 38% Fibonacci retracement and the upper weekly cloud boundary. Cloud support is held. If price manages to move back above the black horizontal resistance and the weekly kijun-sen, then we will have a very bullish setup. We remain bullish.
Le recensioni analitiche di InstaForex ti renderanno pienamente consapevole delle tendenze del mercato! Essendo un cliente InstaForex, ti viene fornito un gran numero di servizi gratuiti per il trading efficiente.


