Revisione a lungo termine
Queste informazioni sono fornite ai clienti al dettaglio e professionisti come parte della comunicazione di marketing. Non contiene e non deve essere interpretata come contenente consigli di investimento o raccomandazioni di investimento o un'offerta o una sollecitazione a impegnarsi in qualsiasi transazione o strategia in strumenti finanziari. Le performance passate non sono una garanzia o una previsione delle performance future. Instant Trading EU Ltd. non rilascia alcuna dichiarazione e non si assume alcuna responsabilità in merito all'accuratezza o completezza delle informazioni fornite, o qualsiasi perdita derivante da qualsiasi investimento basato su analisi, previsioni o altre informazioni fornite da un dipendente della Società o altri. Il disclaimer completo è disponibile qui.
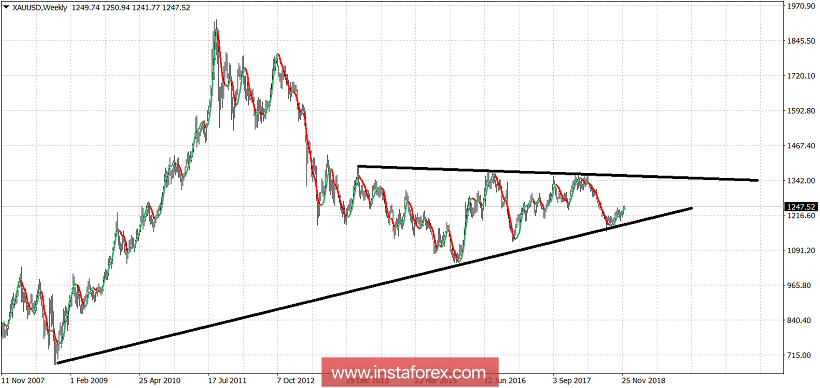
Today we take a look at the weekly chart of Gold. Gold price made an important low back in August and since then it is rising. There is potential to move towards $1,300 again but losing $1,200, could be disastrous for bulls.
Gold has made a double top on a weekly basis around $1,340-50 area. This is a major resistance level. Breaking above it would open the way for a move towards $1,450-$1,500. Gold during September tried to make a higher high but got rejected. This was a bearish sign of weakness. However the pull back respected the upward sloping trend line and did not make a lower low. Gold price is now bouncing off the upward sloping trend line once again and this could unfold into a bigger rally towards the upper trend line resistance. In the short-term Gold is heading towards $1,250-60 or higher towards $1,285 where we find the 61.8% Fibonacci retracement of the entire decline.
As long as Gold price is trading above $1,200-$1,220 bulls remain in control of the trend. If that level fails to hold, we should expect heavy selling to push prices towards $1,000 or lower.
Le recensioni analitiche di InstaForex ti renderanno pienamente consapevole delle tendenze del mercato! Essendo un cliente InstaForex, ti viene fornito un gran numero di servizi gratuiti per il trading efficiente.
 Rimani