 Rimani
Condizioni di trading
Strumenti


Gold price continues to make higher highs and higher lows. The price is approaching our Fibonacci target of 61.8% of the entire decline, as we mentioned in previous posts. There no warning signs for a major top.
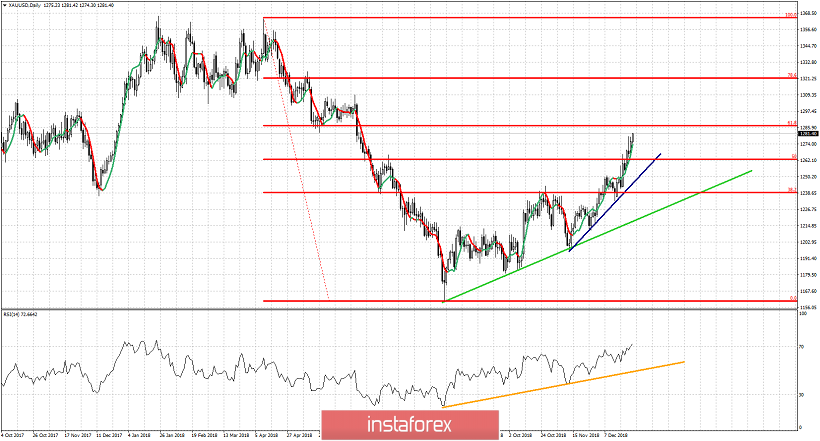
Blue line - short-term support trend line
Gold line - RSI support trend line
Gold price is approaching our $1,287 target where we find the 61.8% Fibonacci retracement level. This is an important resistance area and I expect to see a pause to this upward trend. The Daily RSI has just entered the overbought levels. There is no bearish divergence. Short-term support and possible pullback area is at $1,260. Resistance is at $1,287-90 and the next one is at $1,308. The trend remains bullish. A break below the blue trend line support would be a bearish sign and something that bulls would not like to see as this would put the bullish scenario and bullish medium-term trend in danger.
Le recensioni analitiche di InstaForex ti renderanno pienamente consapevole delle tendenze del mercato! Essendo un cliente InstaForex, ti viene fornito un gran numero di servizi gratuiti per il trading efficiente.

