 Rimani
Condizioni di trading
Strumenti


EUR/USD briefly peaked above 1.15 and as expected has turned lower. Like in early January as I explained in our last analysis, with the Daily RSI overbought and price at the 78.6% Fibonacci retracement level, the chances for a rejection and reversal were high.
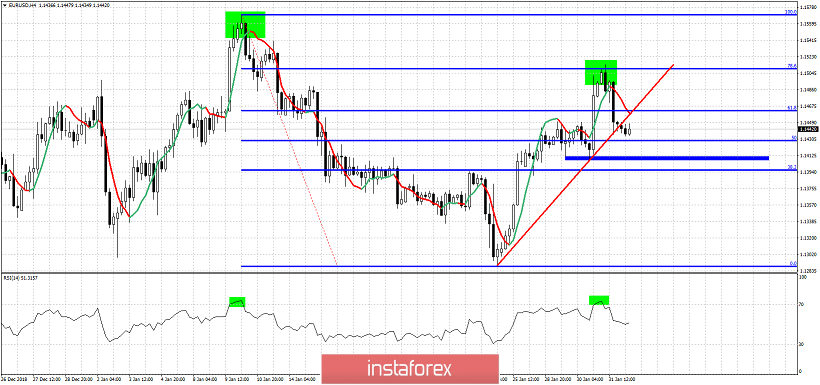
Red line - short-term support trend line
Green rectangles - reversal pattern repeating
EUR/USD got rejected at the 78.6% Fibonacci level and has also broken the short-term trend line support. Major support is found at 1.14. If we break and close the day below it, then we could talk about a similar reversal and bearish move starting like in early January when EUR/USD peaked at 1.1570. As long as EUR/USD is above 1.14 the battle between bulls and bears is still on. A lower high could have formed and this would be confirmed on a break below 1.14. This would be a very bearish sign. On the other hand, bulls want to see EUR/USD price break above yesterday highs and hold above 1.14. So far this pullback can be seen as a backtest of the break out area at 1.14-1.1430. Holding above it will support the bullish scenario. Breaking below it will open the way for a move towards 1.13 and lower.
Le recensioni analitiche di InstaForex ti renderanno pienamente consapevole delle tendenze del mercato! Essendo un cliente InstaForex, ti viene fornito un gran numero di servizi gratuiti per il trading efficiente.

