 Rimani
Condizioni di trading
Strumenti


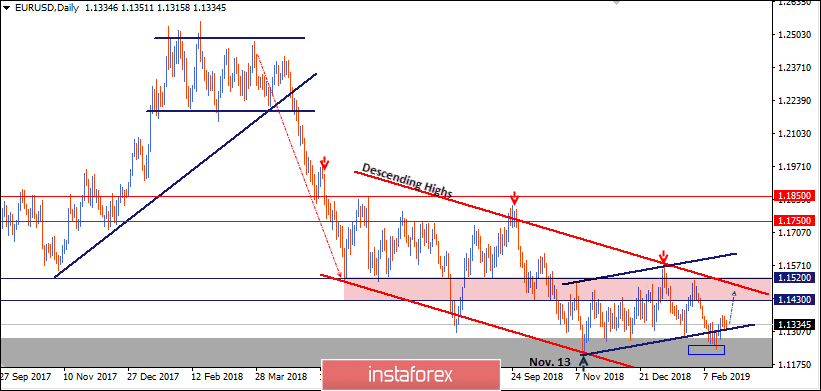
Since June 2018, the EUR/USD pair has been moving sideways with a slight bearish tendency within the depicted bearish channel (in RED).
On November 13, the EUR/USD pair demonstrated recent bullish recovery around 1.1220-1.1250 where the current bullish movement above the depicted short-term bullish channel (In BLUE) was initiated.
Bullish fixation above 1.1430 was needed to enhance a further bullish movement towards 1.1520. However, the market has been demonstrating obvious bearish rejection around 1.1430 few times so far.
The EUR/USD pair has lost its bullish momentum since January 31 when a bearish engulfing candlestick was demonstrated around 1.1514 where another descending high was established then.
On February 5, a bearish daily candlestick closure below 1.1420 terminated the recent bullish recovery.
This allowed the current bearish movement to occur towards 1.1300-1.1270 where the lower limit of the depicted DAILY channel came to meet the pair.
The EUR/USD pair is demonstrating weak bullish recovery around the depicted price zone (1.1300-1.1270). This may indicate high bearish reversal probability (Note Thursday's bearish hammer daily candlestick).
A bearish flag pattern may become confirmed if bearish persistence below 1.1250 is achieved on the daily-chart basis. Pattern target is projected towards 1.1000.
Trade Recommendations:
A counter-trend BUY entry was already suggested near the price level (1.1285) (the lower limit of the depicted movement channel).
T/P level to be located around 1.1350 and 1.1420 while S/L should be advanced to entry level to offset the associated risk.
Le recensioni analitiche di InstaForex ti renderanno pienamente consapevole delle tendenze del mercato! Essendo un cliente InstaForex, ti viene fornito un gran numero di servizi gratuiti per il trading efficiente.


