 Rimani
Condizioni di trading
Strumenti


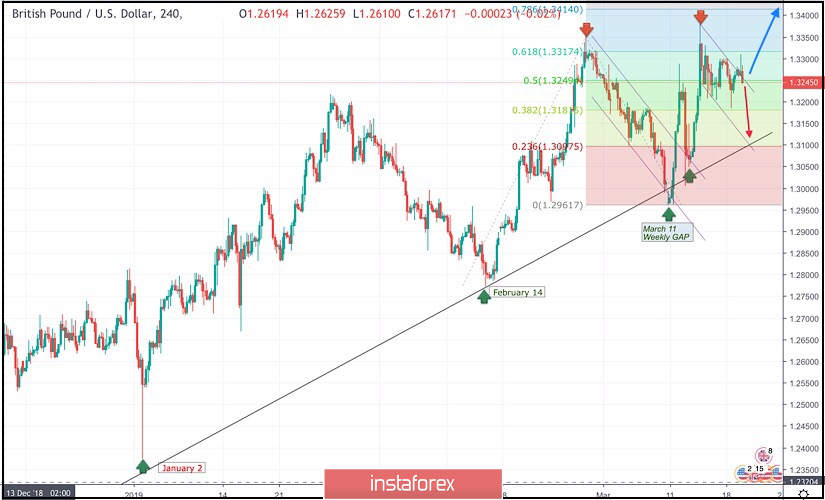
On January 2nd, the market initiated the depicted uptrend line around 1.2380.
This uptrend line managed to push price towards 1.3200 before the GBP/USD pair came to meet the uptrend again around 1.2775 on February 14.
Another bullish wave was demonstrated towards 1.3350 before the bearish pullback brought the pair towards the uptrend again on March 11.
A weekly gap pushed the pair slightly below the trend line (almost reaching 1.2960). However, significant bullish recovery was demonstrated rendering the mentioned bearish gap as a false bearish breakout.
Moreover, a short-term bearish channel was broken to the upside following the mentioned bullish recovery on March 11 rendering the current outlook for the pair as bullish.
As expected, bullish persistence above 1.3060 allowed the GBPUSD pair to pursue the bullish momentum towards 1.3130, 1.3200 then 1.3300.
For the current bullish outlook to remain dominant, bullish persistence above 1.3250 ( 50% Fibonacci expansion level ) is mandatory for confirmation of the depicted Flag pattern.
Bullish Projection targets to be located around 1.3314 and 1.3415.
On the other hand, bearish H4 candlestick closure below 1.3250 (50% Fibonacci Exp. level) invalidates this bullish setup rendering the short term outlook bearish towards 1.3180 then 1.3095 where the depicted uptrend line comes to be tested again.
Trade Recommendations:
Counter-trend traders should wait for a valid SELL signal (H4 candlestick closure below 1.3250). T/P level to be located around 1.3180 and 1.3090. SL to be set as rebound H4 closure above 1.3250 again.
Le recensioni analitiche di InstaForex ti renderanno pienamente consapevole delle tendenze del mercato! Essendo un cliente InstaForex, ti viene fornito un gran numero di servizi gratuiti per il trading efficiente.


