 Rimani
Condizioni di trading
Strumenti


Gold price remains in a weekly down trend after getting rejected at $1,350 area. Price has potential to go towards $1,210 as explained in previous weekly chart analysis. Gold price current action confirms this view if we break below $1,266.
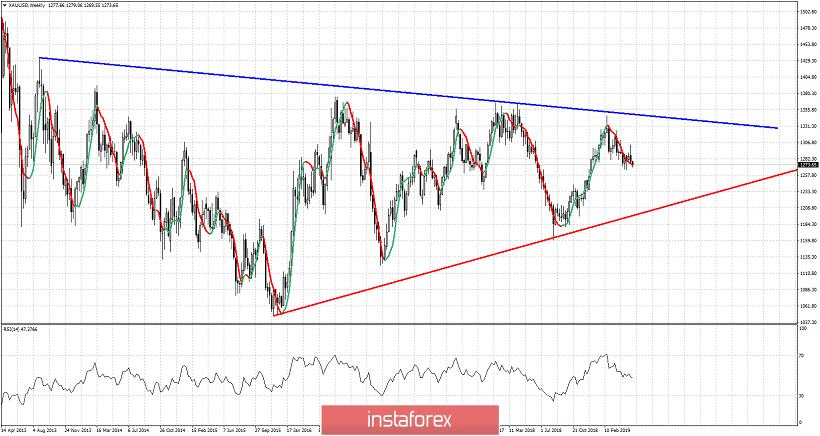
Red line - long-term support trend line
Gold price peaked at the start of the year near the blue trend line resistance and reversed lower. This rejection has increased the chances of a pull back towards the red trend line support, continuing the triangle pattern formation. Short-term support at $1,266 is an important level to watch out for. Breaking below $1,266 increases even more the chances of price reaching the red trend line. The RSI is far from oversold with a negative slope. Trend remains bearish. Major resistance is found at $1,300. Bulls need to recapture this level in order to regain control.
Le recensioni analitiche di InstaForex ti renderanno pienamente consapevole delle tendenze del mercato! Essendo un cliente InstaForex, ti viene fornito un gran numero di servizi gratuiti per il trading efficiente.


