 Rimani
Condizioni di trading
Strumenti


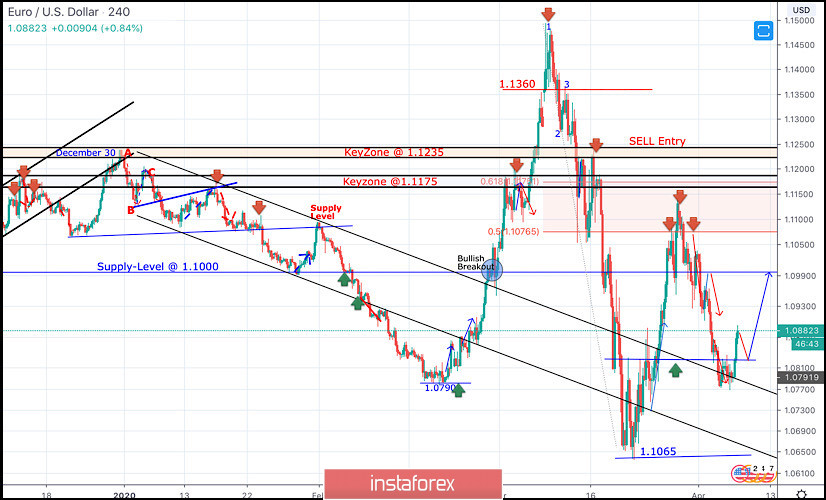
Since December 30, the EURUSD pair has trended-down within the depicted bearish channel until few weeks ago, when a new low around 1.0790 was recently established where the EUR/USD pair looked OVERSOLD after such extensive bearish decline.
On February 20, recent signs of bullish recovery were demonstrated around 1.0790 leading to the recent steep bullish movement towards 1.1000, 1.1175, 1.1360 and finally 1.1480 where a (123) bearish reversal pattern was initiated around.
This turned the short-term technical outlook for the EURUSD pair into bearish when bearish persistence below the Key Zones of 1.1235 and 1.1175 was maintained on a daily basis.
Few weeks ago, the EURUSD pair has expressed significant bullish recovery around the newly-established bottom around 1.1065.
The recent bullish engulfing H4 candlesticks as well as the recently-demonstrated ascending bottoms indicated a high probability bullish pullback at least towards 1.0980 and 1.1075 (Fibonacci Level 50%).
Key Supply-Levels in confluence with significant Fibonacci levels are located around 1.1075 (50% Fibonacci) and 1.1175 (61.8% Fibonacci) where bearish rejection was highly-expected.
Moreover, a Head & Shoulders reversal pattern was demonstrated around the price levels of (1.1000 - 1.1075).
Shortly after, further bearish decline was demonstrated towards 1.0800 where the nearest demand level to be considered was located near the backside of the broken channel (1.0800-1.0750).
Today, Early signs of Bullish rejection have been manifested around (1.0800-1.0750) leading to the current bullish spike up to 1.0880.
This supports the bullish side of the market as long as bullish persistence is maintained above the recently-established ascending high around 1.0770.
Trade recommendations :
Intraday traders can wait for another bearish pullback towards the mentioned demand-zone around 1.0800-1.0750 for a valid short-term BUY signal.
S/L to be placed below 1.0740 while Initial T/P level to be located around 1.0870, 1.0920 and 1.1000.
Le recensioni analitiche di InstaForex ti renderanno pienamente consapevole delle tendenze del mercato! Essendo un cliente InstaForex, ti viene fornito un gran numero di servizi gratuiti per il trading efficiente.

