empty
 
 
Stai per lasciare
www.instaforex.eu >
il sito gestito da
INSTANT TRADING EU LTD
Apri un conto

04.07.201711:25 Forex Analysis & Reviews: Technical analysis and trading recommendations for USD / JPY pair on July 3, 2017

Revisione a lungo termine
Queste informazioni sono fornite ai clienti al dettaglio e professionisti come parte della comunicazione di marketing. Non contiene e non deve essere interpretata come contenente consigli di investimento o raccomandazioni di investimento o un'offerta o una sollecitazione a impegnarsi in qualsiasi transazione o strategia in strumenti finanziari. Le performance passate non sono una garanzia o una previsione delle performance future. Instant Trading EU Ltd. non rilascia alcuna dichiarazione e non si assume alcuna responsabilità in merito all'accuratezza o completezza delle informazioni fornite, o qualsiasi perdita derivante da qualsiasi investimento basato su analisi, previsioni o altre informazioni fornite da un dipendente della Società o altri. Il disclaimer completo è disponibile qui.

4-hour timeframe

Exchange Rates 04.07.2017 analysis

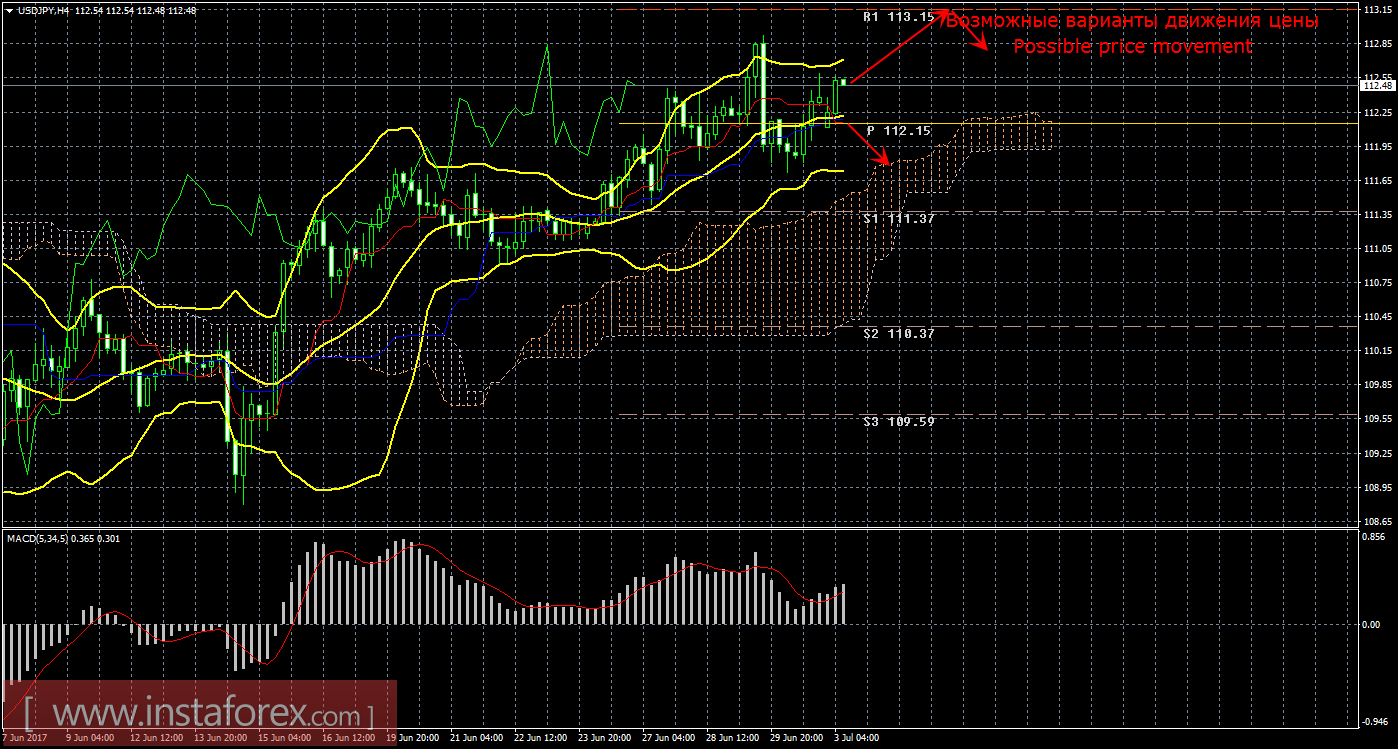
The amplitude of the previous day (high-low): 87 points.

The distance of the past day: 270 points.

THE BIG PICTURE:

If the price falls below this line, the current "golden cross" will become weak again.

Trading recommendations:

The Japanese yen in the Foreign exchange market is recommended to consider buying the pair with the first target at 113.15 level followed by 113.93 as the second target.

Aside from the technical aspect, traders should also consider the fundamental data and their scheduled releases.

When there is a possibility to open deals in advance, switch to the smaller timeframe (M15-M30) and monitor the reversal of the trend indicators (e.g. Heiken Ashi) considering the price level and the possibility for a pullback.

Explanation of the picture:

Ichimoku:

Tenkan-sen - red line.

Kijun-sen - blue line.

Senkou Span A - light brown dotted line.

Senkou Span B - light purple stipple line.

Chinkou Span - green line.

Bollinger Bands indicator:

3 yellow lines.

MACD indicator:

The red line and the histogram with the white bars in the indicators window.
Eseguito da Paolo Greco
Esperto analista di InstaForex
© 2007-2025

Apri un conto di trading

Le recensioni analitiche di InstaForex ti renderanno pienamente consapevole delle tendenze del mercato! Essendo un cliente InstaForex, ti viene fornito un gran numero di servizi gratuiti per il trading efficiente.


Stai per lasciare www.instaforex.eu, il sito Web gestito da INSTANT TRADING EU LTD
In questo momento non potete parlare al telefono?
Ponete la vostra domanda nella chat.
Widget callback

Turn "Do Not Track" off