 Rimani
Condizioni di trading
Strumenti


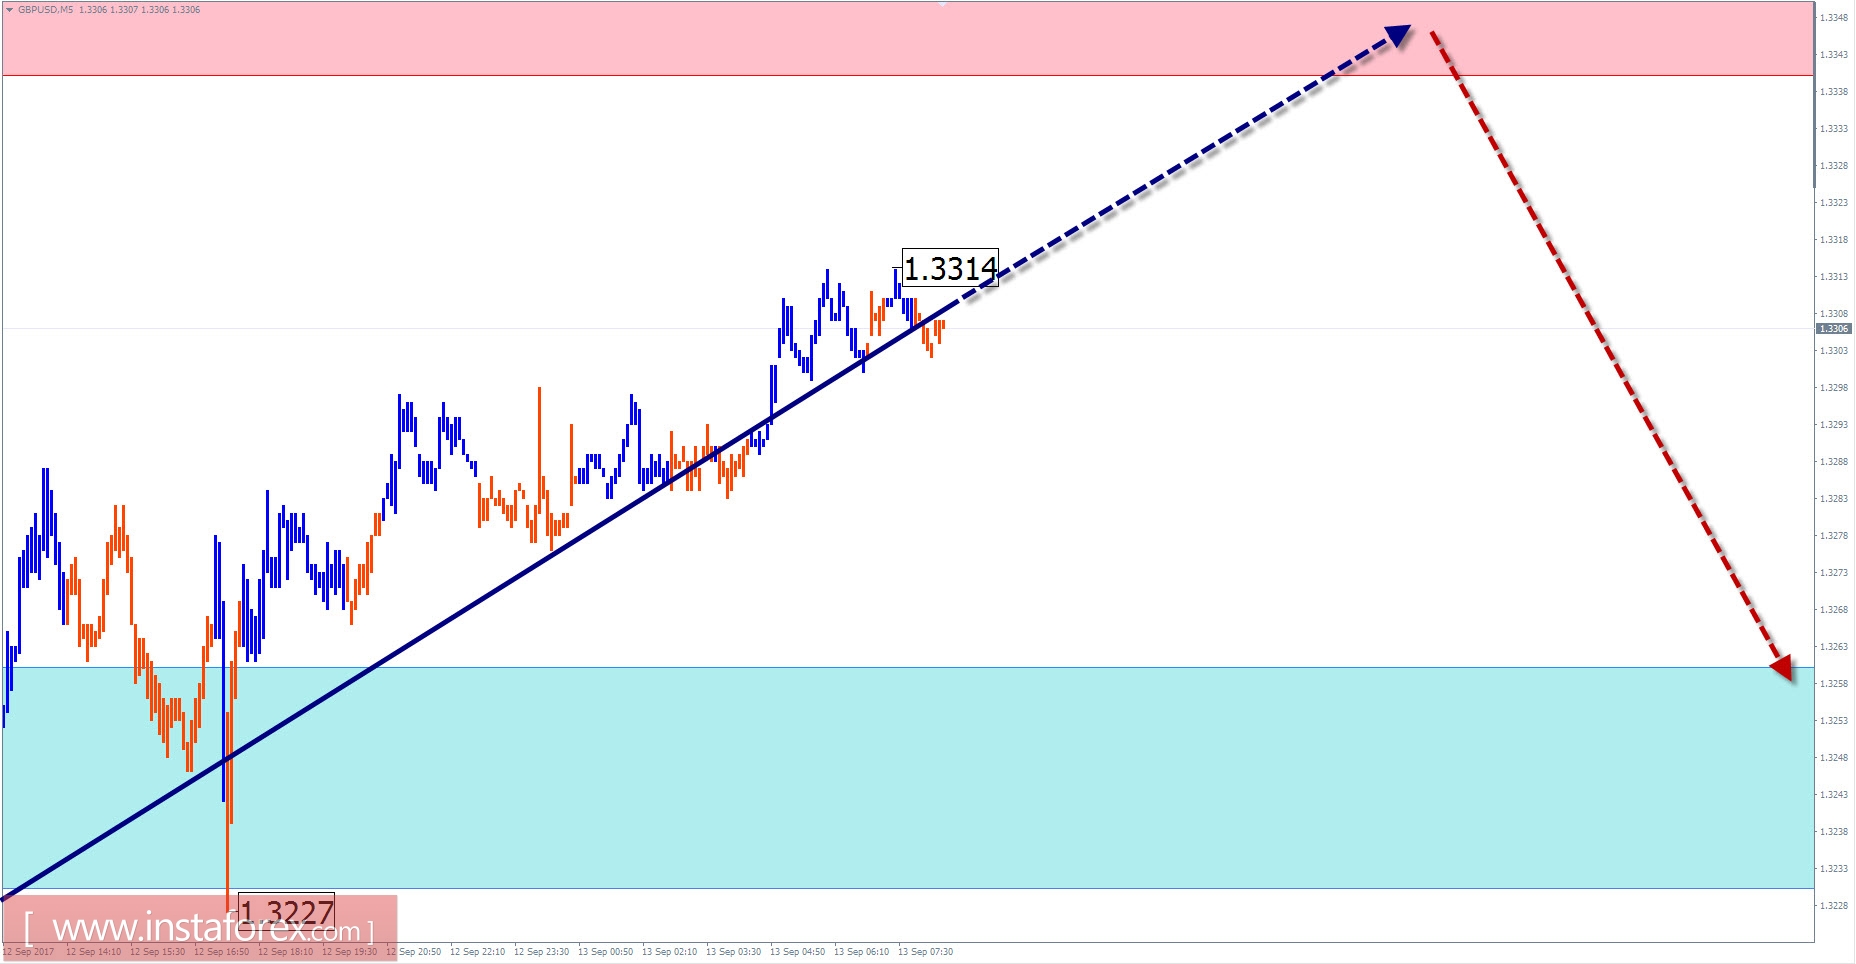
GBP / USD outlook for the current day
As shown on the chart of the major pair, the sterling pound is forming an upward wave at the end of 2016. While in a larger model, it takes the place of correction. The upside potential is close to completion. The prices since the beginning of this week are in the framework of a stronger zone of a potential reversal. The wave analysis of the last wave indicates an ascending zigzag of June 21. In the final part (C) was almost completed.
Today, the completion of the current recovery is expected. The adjustments in the exchange rate of the pair would likely occur within the estimated resistance zone. A short break in its upper limit is possible, but the chance is not that high. During the second half of the day, the beginning of the decline is further anticipated.
Boundaries of resistance zones:
- 1.3340 / 70
Boundaries of support zones:
- 1.3260 / 30
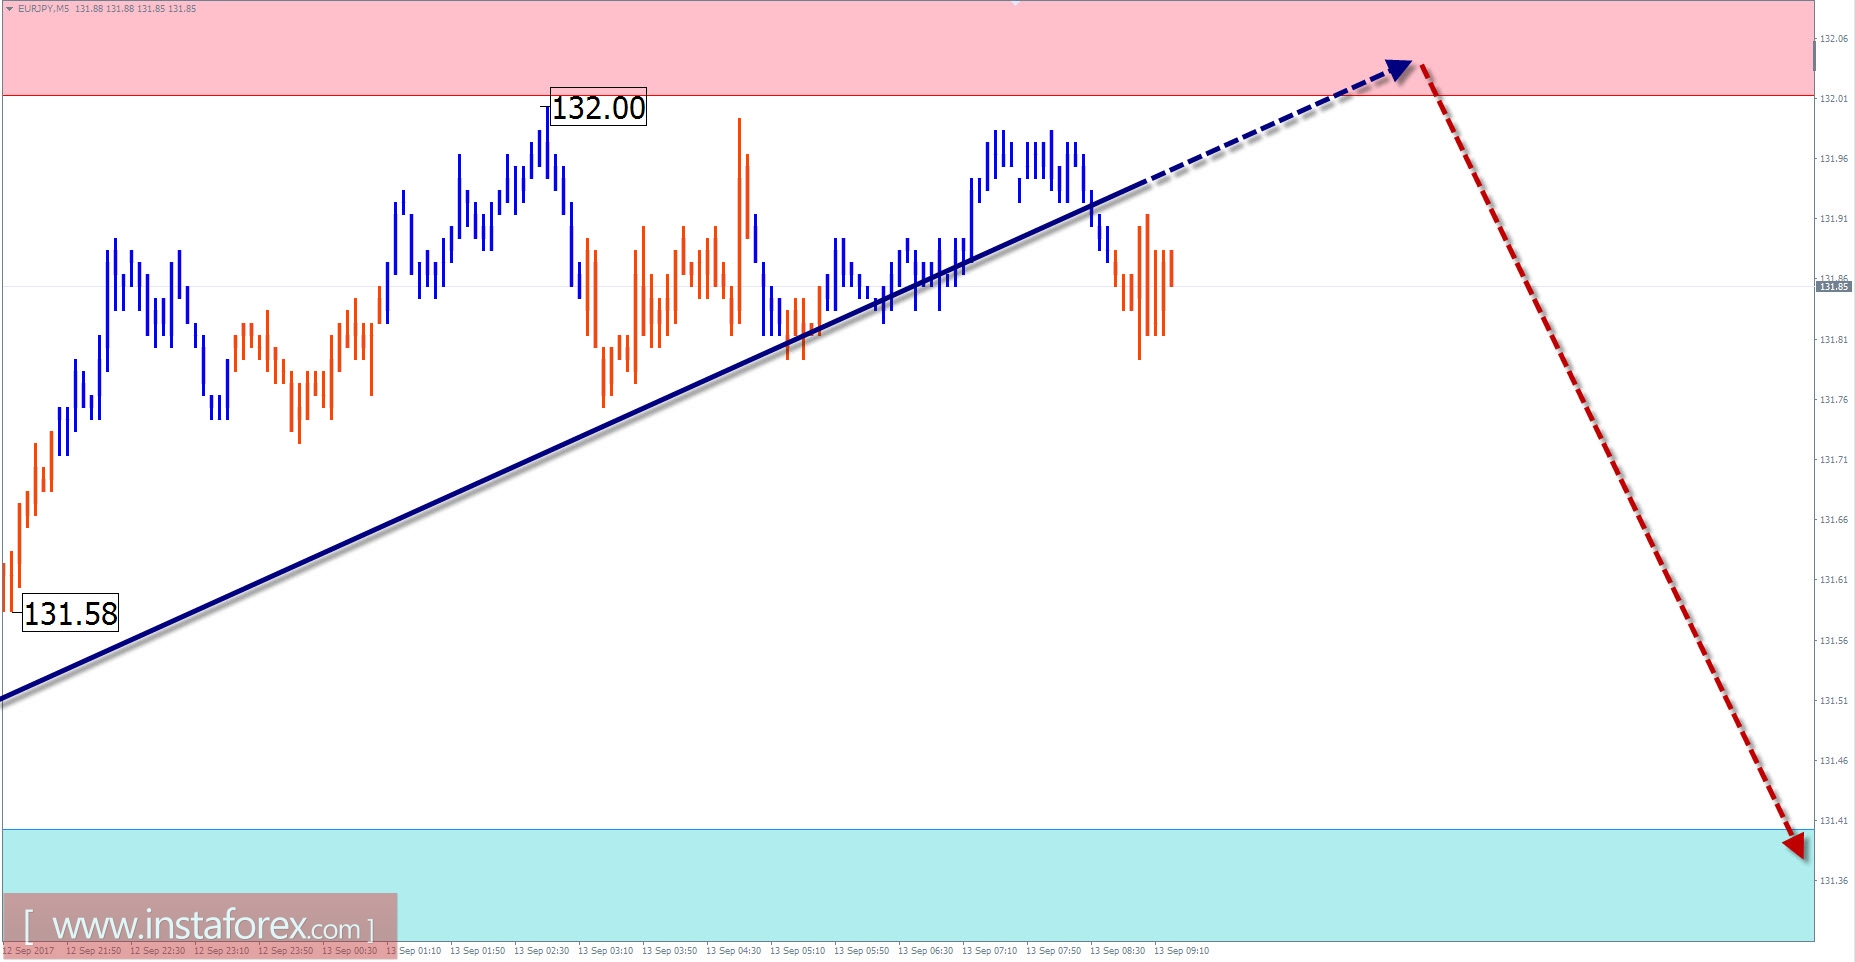
EUR/JPY outlook with current day forecast
The rising wave of the EUR/JPY cross pair continues to renew its highs. After breaking through the clusters of counter levels, the lower boundary of the preliminary target zone was revised, at least 6 price figures higher.
The wave analysis last week shows the formation of an intermediate correctional wave necessary to raise the wave level of the trend before continuing the recovery. Given the impulsive nature of the main trend, the correction will mainly show in the form of a flat position. A weak downward trajectory of price movement is possible. The preliminary target of the correction is the strong level of support, which was formerly the resistance.
Today, the possible scenario is the pair's movement towards the sideways trend. The descending trajectory may develop by the end of the day. A breakthrough of the upper limit of the resistance zone is possible as the current trading week nearly ends.
Boundaries of resistance zones:
- 132.00 / 132.30
Boundaries of support zones:
- 131.40 / 10
Explanations to the figures: For simplified wave analysis, a simple waveform is used that combines 3 parts (A; B; C). Of these waves, all kinds of correction are composed mostly of the impulses. On each considered time frame, the last and incomplete wave is analyzed.
The areas marked in the graphs are indicated by the calculation areas in which the probability of change in the direction significantly increased. Arrows indicate the wave counting according to the technique used by the author. The solid background of the arrows indicates the formed structure, the dotted one indicates the expected wave motion.
Attention: The wave algorithm does not take into account the duration of tool movements in time. The forecast is not a trading signal! To conduct a trade transaction you need confirmation signals used by your trading systems.
Le recensioni analitiche di InstaForex ti renderanno pienamente consapevole delle tendenze del mercato! Essendo un cliente InstaForex, ti viene fornito un gran numero di servizi gratuiti per il trading efficiente.

