 Rimani
Condizioni di trading
Strumenti


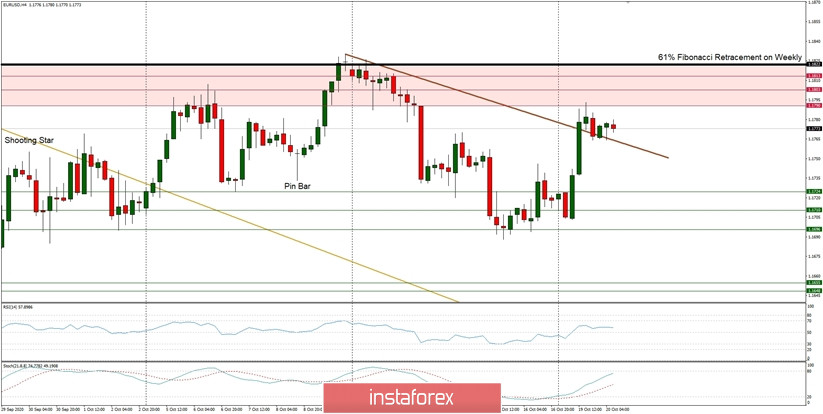
Technical Market Outlook:
The EUR/USD made a local lower low at the level of 1.1688, just below the technical support seen at the level of 1.1696 and then bounced higher in order to break through the local trend line resistance. The local high was made at the level of 1.1792, which is a part of the old Supply Zone. The next target for bulls is seen at the level of 1.1822, which is the 61% Fibonacci retracement level from the weekly time frame. The price had been testing this level many times before, but is still unable to leave it alone. The nearest intraday support is seen at the level of 1.1764.
Weekly Pivot Points:
WR3 - 1.1924
WR2 - 1.1873
WR1 - 1.1783
Weekly Pivot - 1.1733
WS1 - 1.1641
WS2 - 1.1593
WS3 - 1.1509
Trading Recommendations:
Since the middle of March 2020 the main trend is on EUR/USD pair has been up, which can be confirmed by almost 10 weekly up candles on the weekly time frame chart and 4 monthly up candles on the monthly time frame chart. Nevertheless, weekly chart is recently showing some weakness in form of a several Pin Bar candlestick patterns at the recent top seen at the level of 1.2004. This means any corrections should be used to buy the dips until the key technical support is broken. The key long-term technical support is seen at the level of 1.1445. The key long-term technical resistance is seen at the level of 1.2555.
Le recensioni analitiche di InstaForex ti renderanno pienamente consapevole delle tendenze del mercato! Essendo un cliente InstaForex, ti viene fornito un gran numero di servizi gratuiti per il trading efficiente.

