 Rimani
Condizioni di trading
Strumenti


The currency pair has printed a Head & Shoulders reversal pattern signaling that the bears will drag the rate down in the short term. USD/JPY is trading at the 105.24 level, a valid breakdown through the neckline should active the chart pattern and a sell-off.
USDX's decline helps the Yen to strike back versus the greenback in the short term. The JPY could dominate the currency market if the Nikkei stock index develops a corrective phase after the most recent upwards swing.
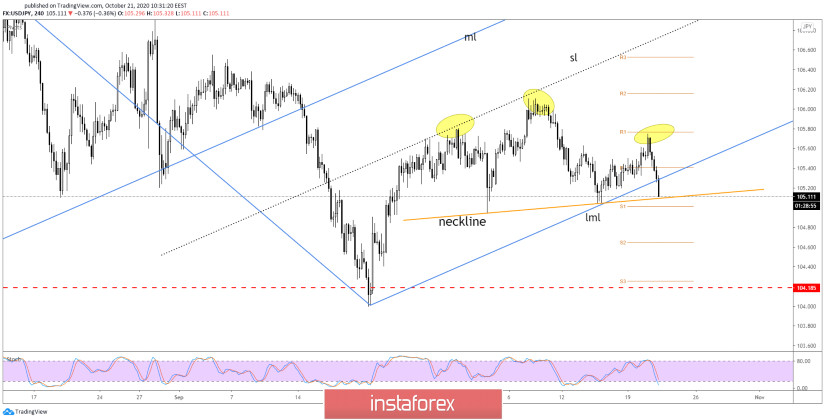
USD/JPY increased between the lower median line (lml) of the ascending pitchfork and the sliding parallel line (sl), but unfortunately, the buyers failed to keep the price within the ascending pitchfork's body.
Now, the pair is trading under the lower median line (lml), dynamic support, and is almost to challenge the H&S neckline. A valid breakdown below this level and under the S1 (105.01) suggests selling as USD/JPY could extend its current sell-off.
Sell a valid breakdown (close and retest) below the neckline and under the S1 with a potential downside target at the S3 (104.25).
The H&S chart pattern could be invalidated only another higher high, jump, and close above 105.74 level.
Le recensioni analitiche di InstaForex ti renderanno pienamente consapevole delle tendenze del mercato! Essendo un cliente InstaForex, ti viene fornito un gran numero di servizi gratuiti per il trading efficiente.

