 Rimani
Condizioni di trading
Strumenti


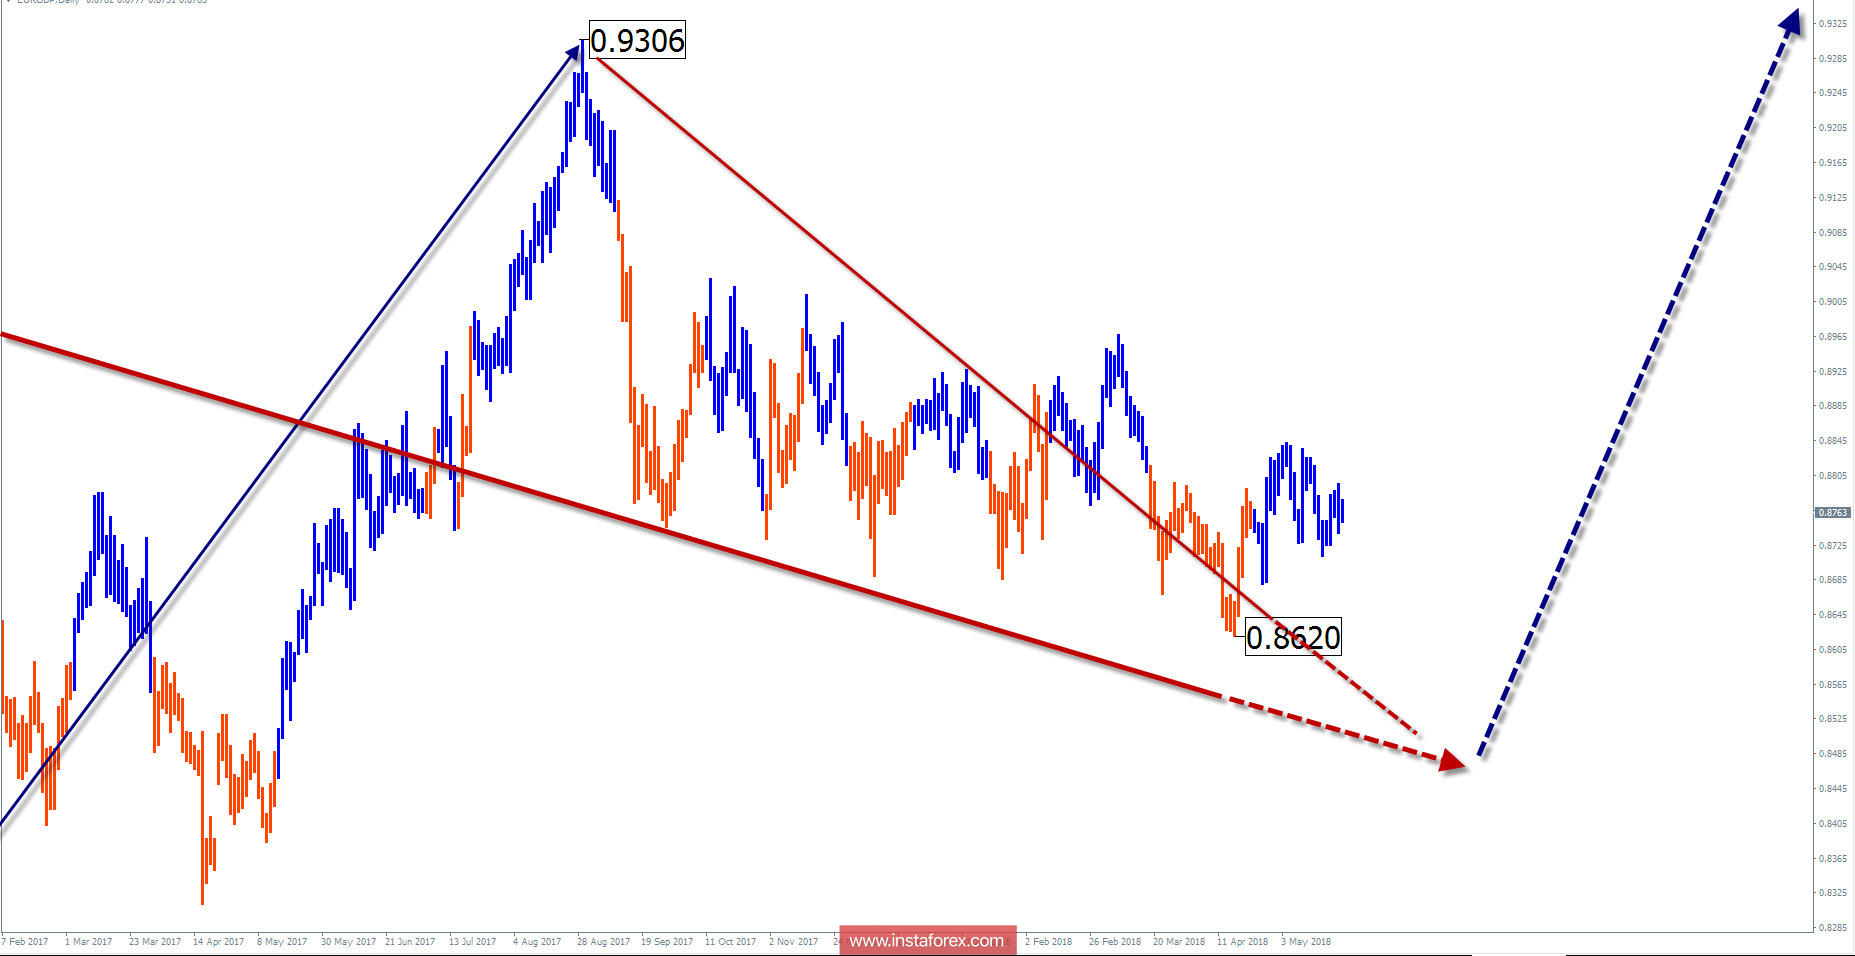
Wave picture of the D1 chart:
The unfinished downward wave of August 29 last year is the final part of the correction in a larger wave model. Correction has an incorrect view, so the potential decline is expected to be minimal. Quotations are already within the scope of the potential reversal zone.
The wave pattern of the H1 graph:
The direction of the price movement is set by the upward wave of April 17. In its structure, the first part (A) is completed. The middle part of the wave is in the formation stage.
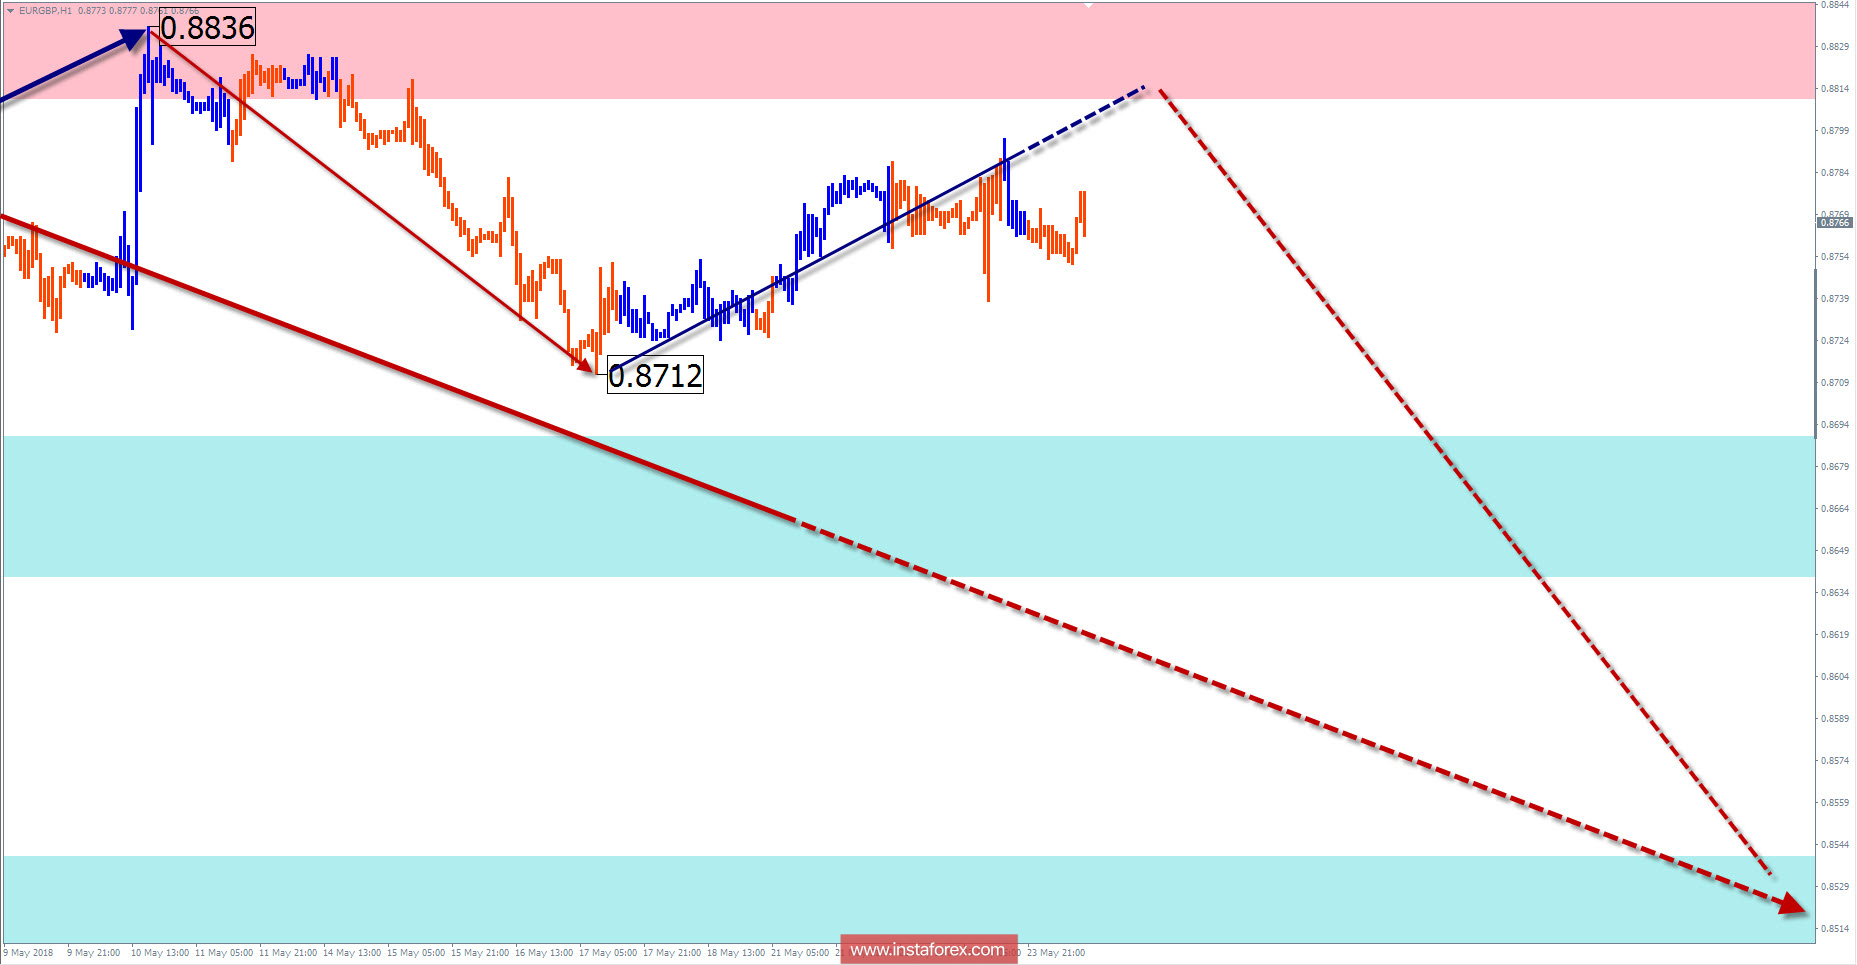
The wave pattern of the M15 chart:
The descending zigzag since May 10 is distinctly outlined on the graph. In the wave, the ascending rollback is not completed. The resistance zone would likely be the area of reversal.
Recommended trading strategy:
Supporters of intraday trading can look for selling signals in the area of calculated resistance. There is no pair for the larger styles of the trade signals on the market.
Resistance zones:
- 0.8810 / 0.8860
Support zones:
- 0.8690 / 0.8640
- 0.8540 / 0.8490
Explanations to the figures: Simplified wave analysis uses a simple waveform, in the form of a 3-part zigzag (ABC). Every TF shows that the last incomplete wave is analyzed. Zones show the calculated areas with the greatest probability of a reversal.
Arrows indicate the wave counting according to the technique used by the trader. The solid background shows the generated structure, dotted - the expected wave motion.
Attention: The wave algorithm does not take into account the duration of the tool movements in time. To conduct a trade transaction, you need confirmation signals from your trading systems!
* The presented market analysis is informative and does not constitute a guide to the transaction.
Le recensioni analitiche di InstaForex ti renderanno pienamente consapevole delle tendenze del mercato! Essendo un cliente InstaForex, ti viene fornito un gran numero di servizi gratuiti per il trading efficiente.


