 Rimani
Condizioni di trading
Strumenti


The wave pattern of the D1 graph:
Since the beginning of last year, the direction of the main trend of this instrument indicates a downward wave. Analysis of the structure indicates its incompleteness.
The wave pattern of the H1 graph:
Since February this year, the price movement of the pair has begun a new, ascending stage. In a larger wave model, the price forms a correction. Calculation of the stroke potential allows us to wait for the growth of the rate in the region by 4 figures.
The wave pattern of the M15 chart:
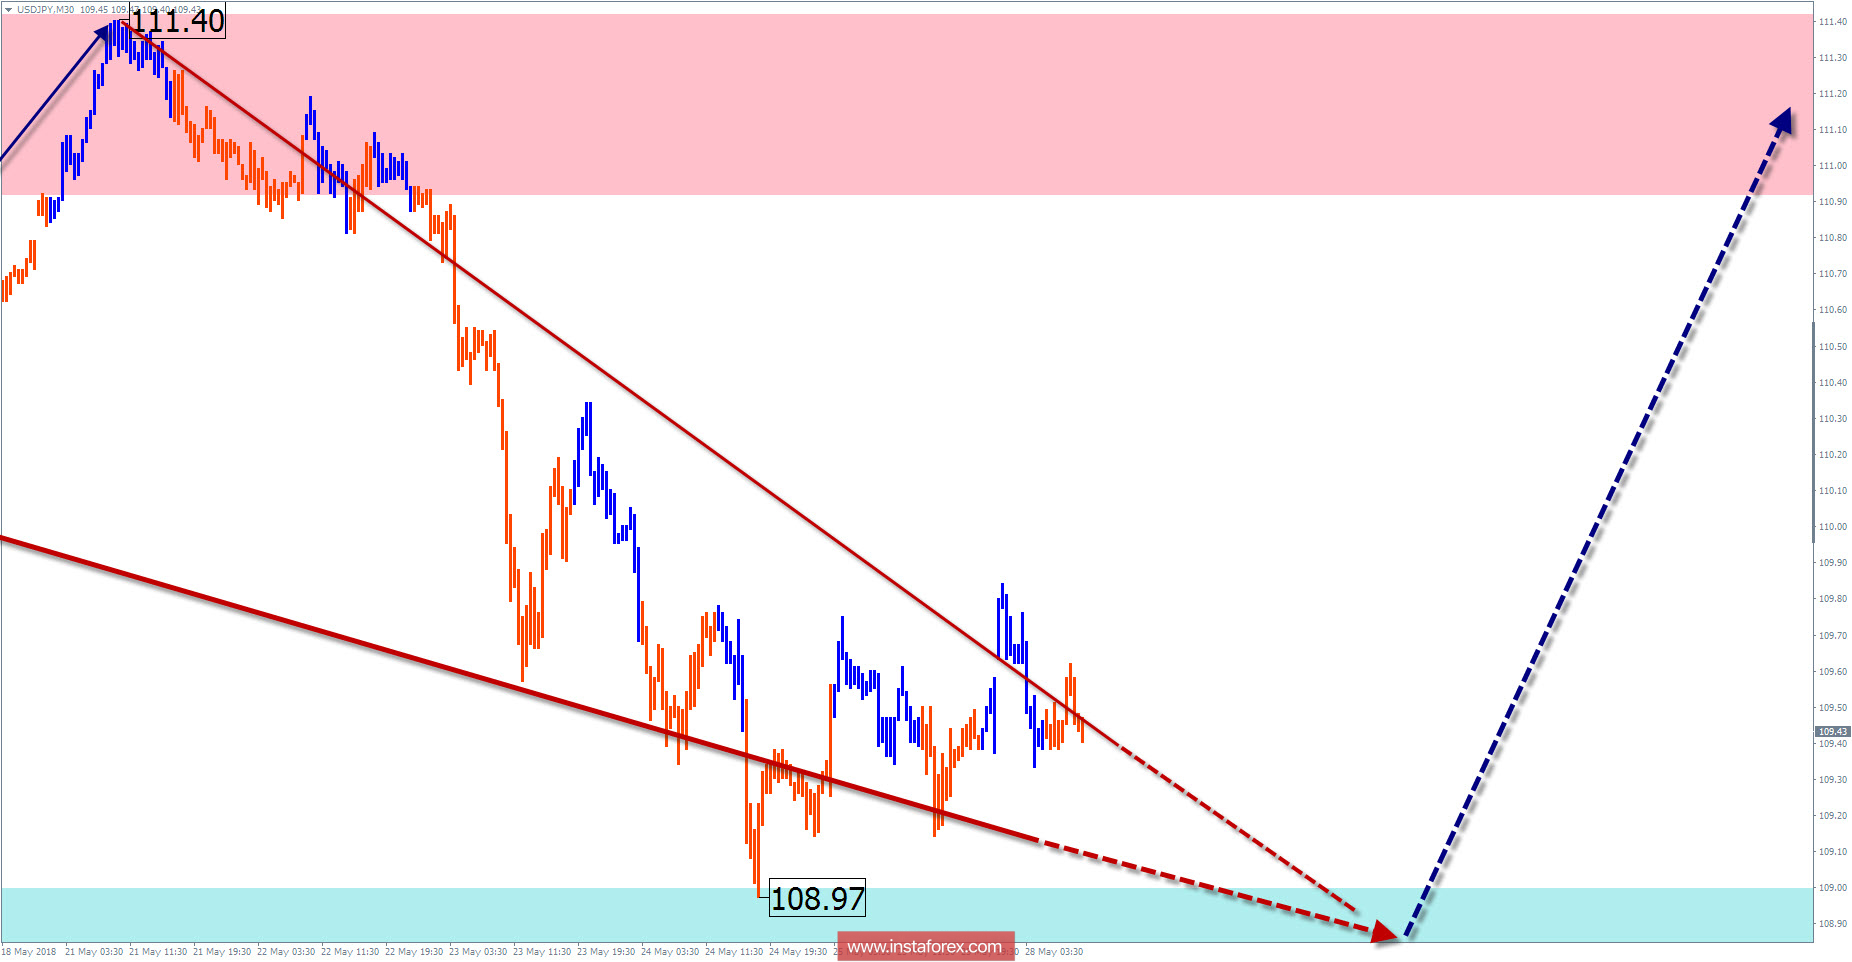
The interdivisional direction of the price is directed to the "south". The price is near the upper boundary of the target zone. In the coming days, we can wait for the completion of the descending section, which is the final part of the hidden correction.
Recommended trading strategy:
There are no signals for large segments of the chart. For the inter-day trading style, you should wait in the reversal zone for signals to buy a pair.
Resistance zones:
- 110.90 / 111.40
Support zones:
- 109.00 / 108.50
Explanations to the figures:
A simplified wave analysis uses a simple waveform, in the form of a 3-part zigzag (ABC). The last incomplete wave for every timeframe is analyzed. Zones show the calculated areas with the greatest probability of a turn.
Arrows indicate the counting of wave according to the technique used by the author. The solid background shows the generated structure and the dotted exhibits the expected wave motion.
Attention: The wave algorithm does not take into account the duration of the tool movements in time. To conduct a trade transaction, you need to confirm the signals used by your trading systems.
Le recensioni analitiche di InstaForex ti renderanno pienamente consapevole delle tendenze del mercato! Essendo un cliente InstaForex, ti viene fornito un gran numero di servizi gratuiti per il trading efficiente.

