 Rimani
Condizioni di trading
Strumenti


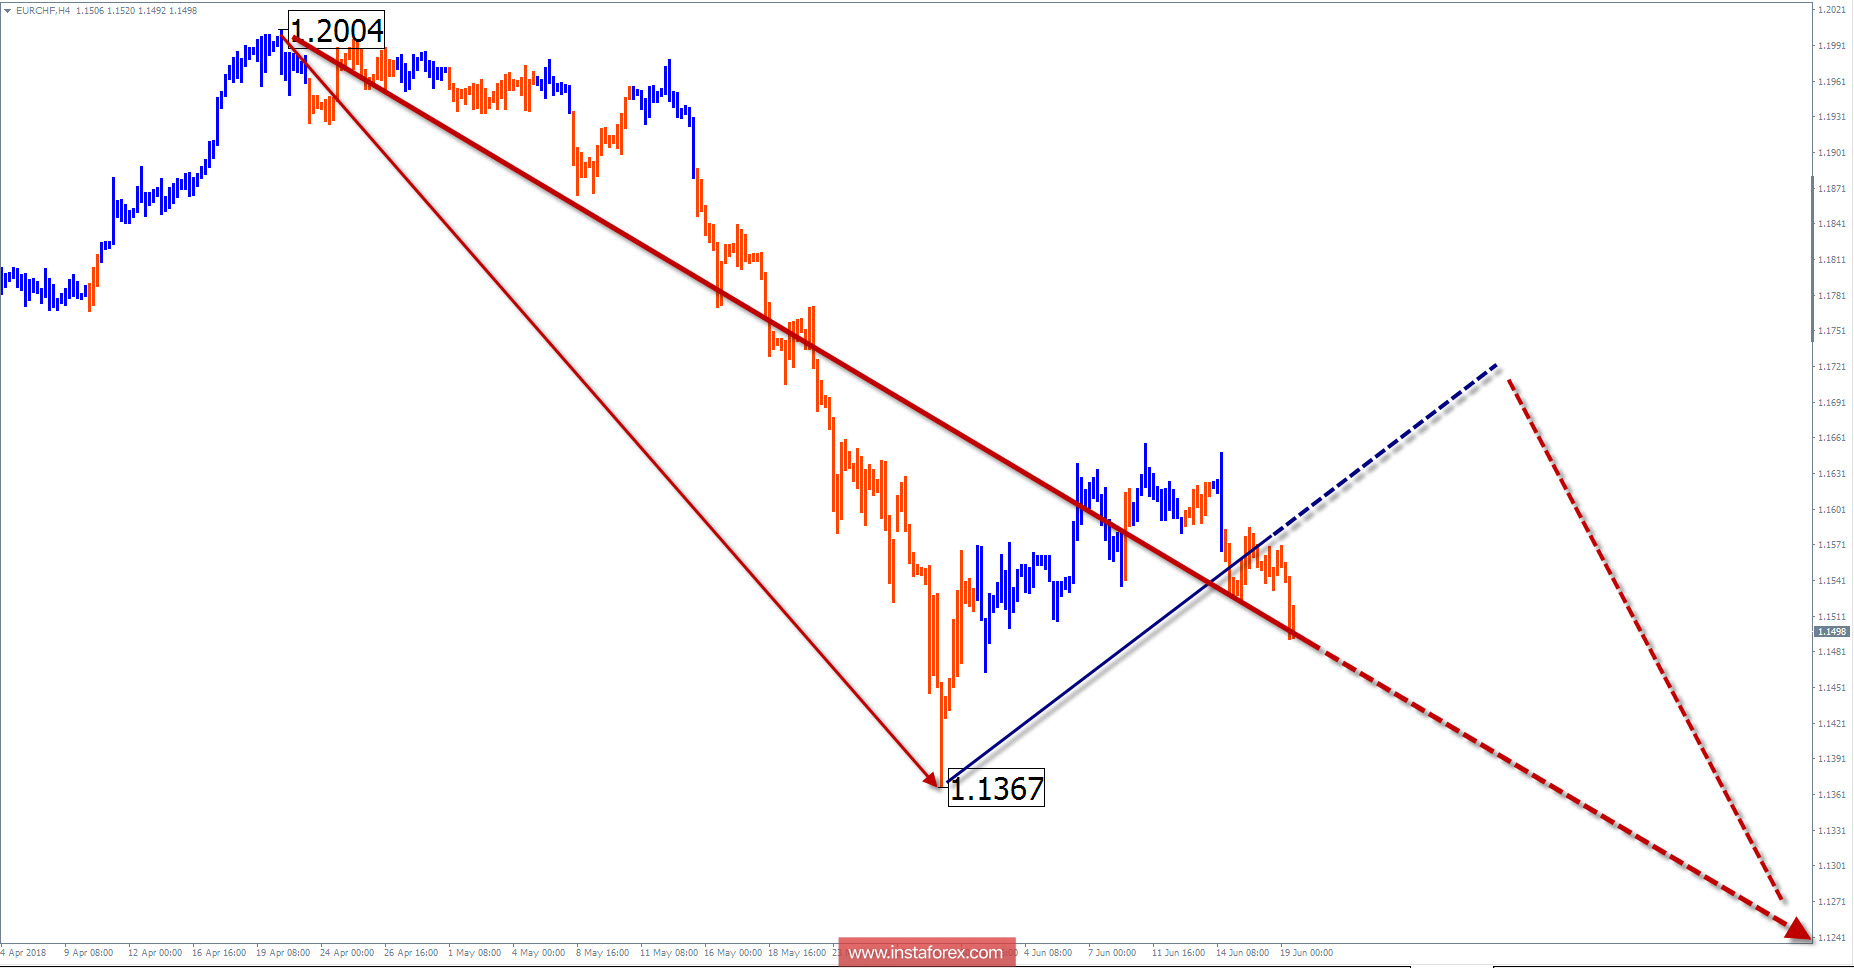
Wave picture of the chart H4:
In the upward trend of the daily chart scale, the last wave of H4 counts from April 20. The wave is descending, its structure is not complete. The upper boundary of the preliminary target zone is in 3 figures below the current rate.
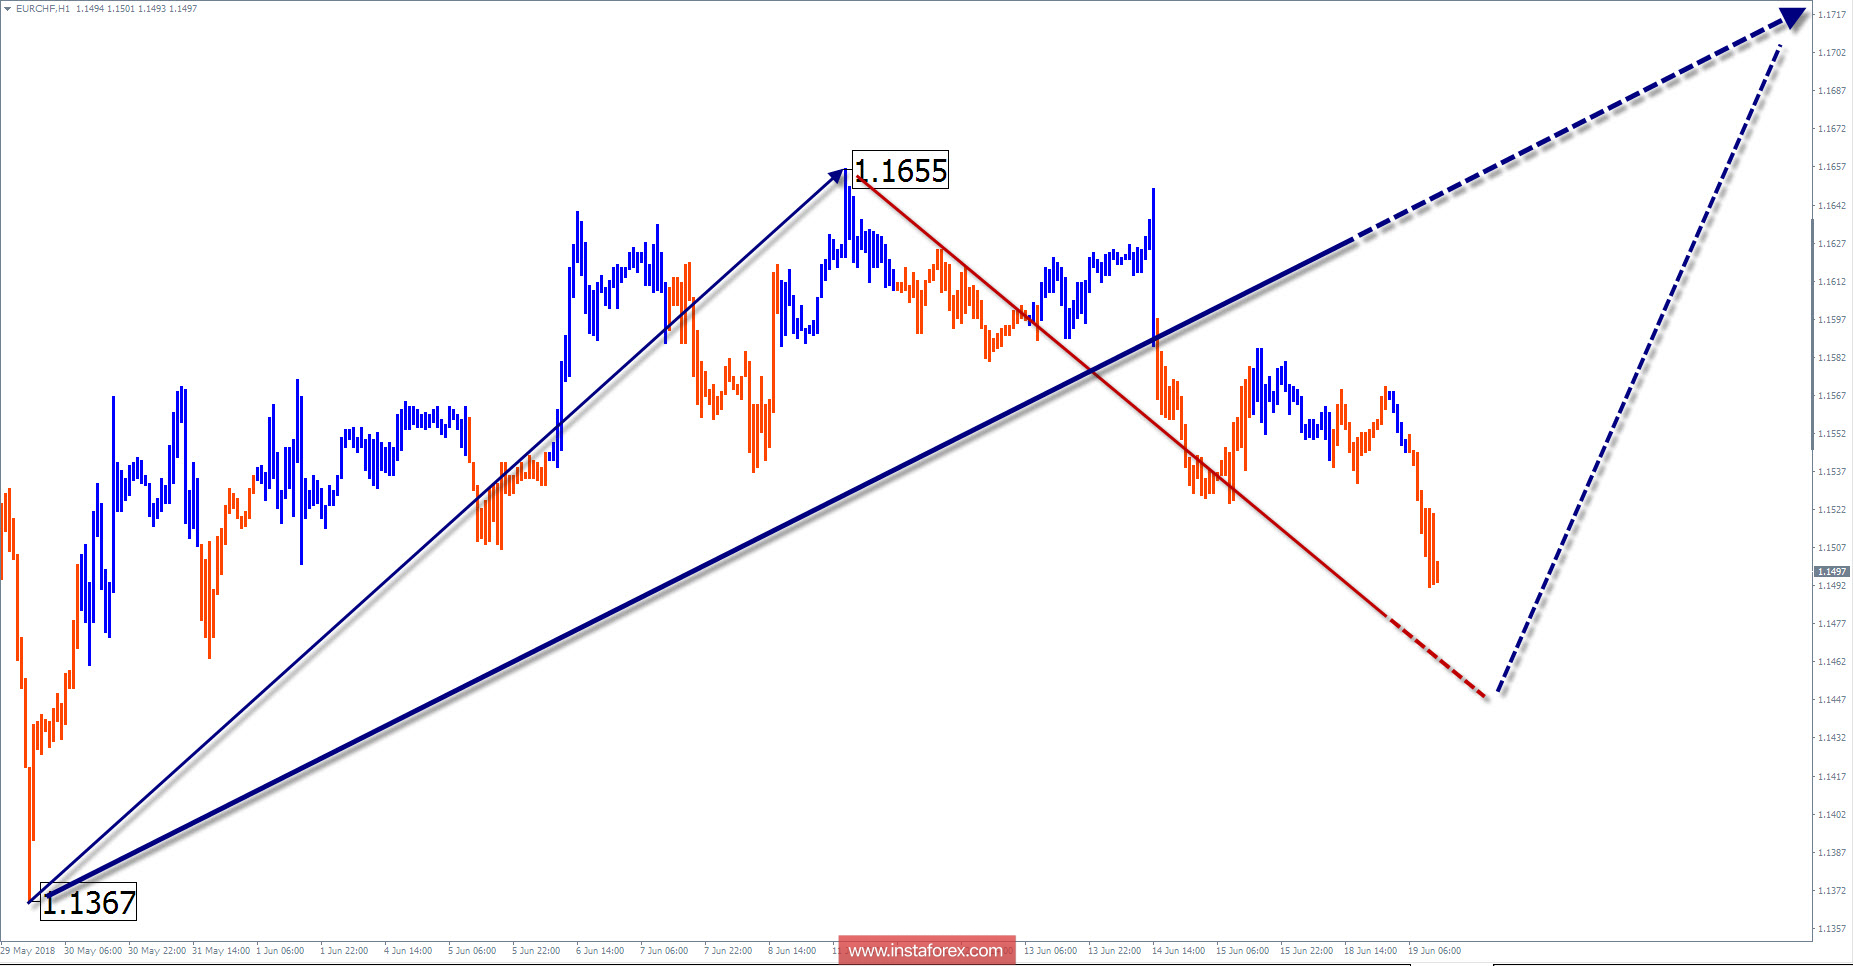
The wave pattern of the graph H1:
The ascending segment from May 29 forms the first part (A) of the correction. In recent weeks, the price has started forming the opposite segment of the graph (B).
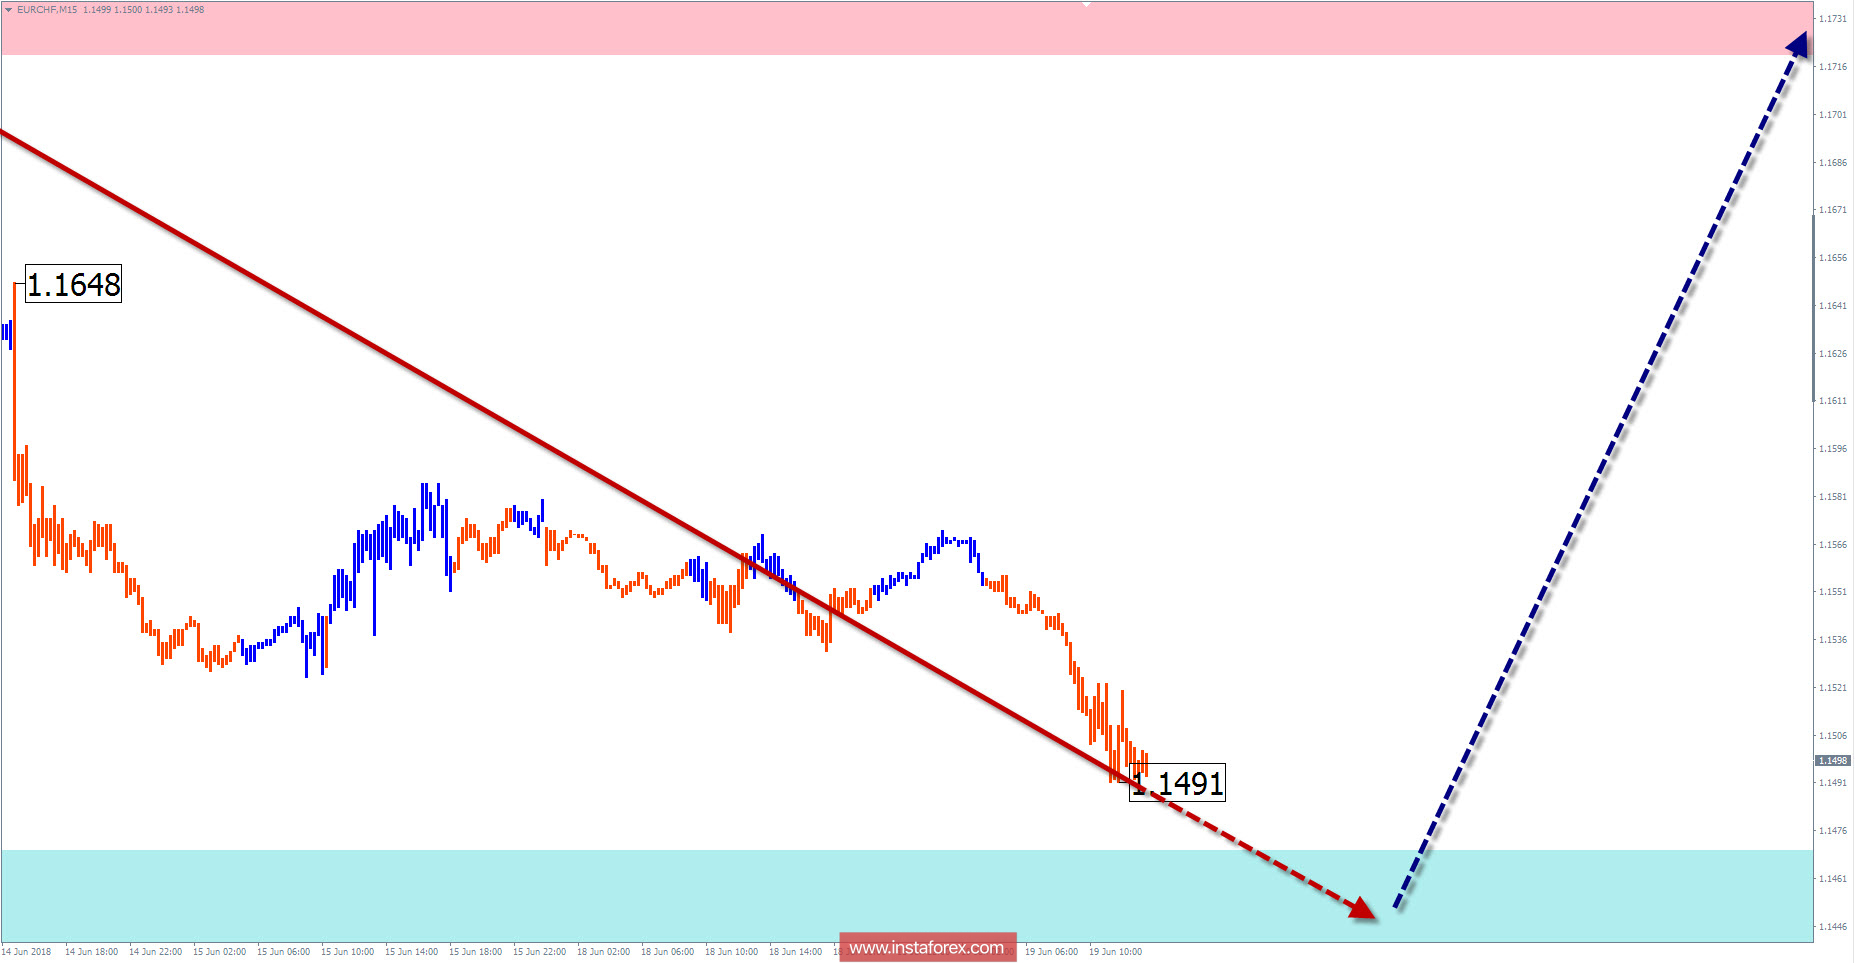
The wave pattern of the M15 chart:
The descending wave of June 11 has a small potential and is close to completion. In a larger wave model, it adjusts the first part of the zigzag, before jerking to the final part (C).
Recommended trading strategy:
For the merchants, there are no large TF signals yet. It is necessary to wait for the completion of the current bearish wave. Within the next week, the couple's purchases will be relevant.
Resistance zones:
- 1.1720 / 1.1770
Support zones:
- 1.1470 / 1.1420
Explanations to the figures: In a simplified wave analysis, waves consisting of 3 parts (A-B-C) are used. For analysis, 3 main TFs are used, on each one the last, incomplete wave is analyzed. Zones show the calculated areas with the greatest probability of a turn.
Arrows indicate the wave counting according to the technique used by the author. The solid background shows the generated structure, the dotted - the expected movements.
Attention: The wave algorithm does not take into account the duration of the tool movements in time. To conduct a trade transaction, you need confirmation signals from your trading systems!
Le recensioni analitiche di InstaForex ti renderanno pienamente consapevole delle tendenze del mercato! Essendo un cliente InstaForex, ti viene fornito un gran numero di servizi gratuiti per il trading efficiente.

