 Rimani
Condizioni di trading
Strumenti


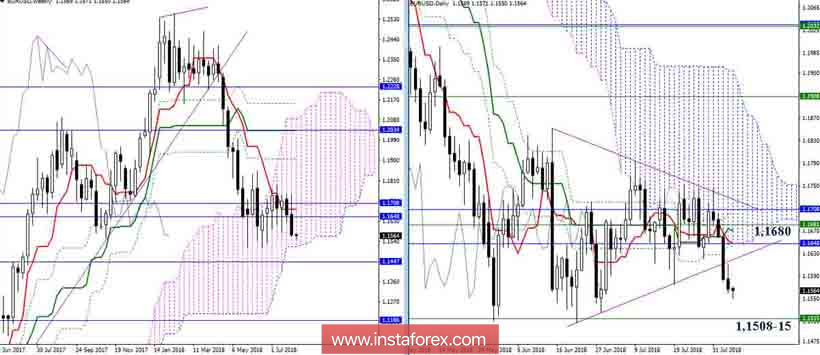
EUR / USD
Bears fairly optimistically closed last week, indicating the potential for continuing the decline. The main interest in this direction is now concentrated in the zone 1.1508-15 (minimum extremum + week-old Senkou Span B), since the primary task of the bears now is to break the weekly cloud and restore the downtrend. Next, the bears will need to focus on eliminating the monthly golden cross (1.1447 Kijun + 1.1186 Fibo Kijun). The key zone of resistance today has retained its location. Its borders still form 1.1648 (monthly Senkou Span A + daytime Senkou Span A + day Tenkan) and 1.1708 (monthly Fibo Kijun + daytime Fibo Kijun), and the center is still the level of 1.1680 (Weekly Tenkan).
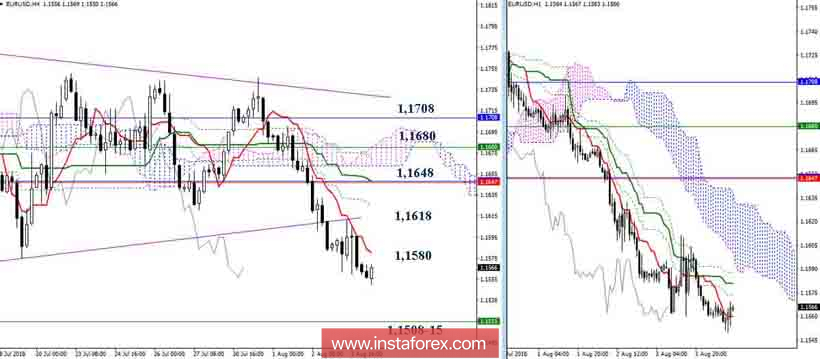
The Ichimoku indicator at the lower time intervals now supports players on a slide. The downward direction is now the levels of the senior half in the region 1.1508-15. In the case of developing an upward correction, the nearest resistance may be provided by the levels of lower time intervals of 1.1581 (Tenkan H4 + Kijun H1) and 1.1618 (Fibo Kijun H4 + Senkou Span B N1). Further, the development of the situation will depend on the interaction with the key zone of resistance and attraction of this section 1.1648 - 1.1680 - 1.1708.
Indicator parameters:
All time intervals 9 - 26 - 52
The color of indicator lines:
Tenkan (short-term trend) - red,
Kijun (medium-term trend) - green,
Fibo Kijun is a green dotted line,
Chinkou is gray,
Clouds: Senkou Span B (SSB, long-term trend) - blue,
Senkou Span A (SSA) - pink.
The color of additional lines:
Support and resistance MN - blue, W1 - green, D1 - red, H4 - pink, H1 - gray,
Horizontal levels (not Ichimoku) - brown,
Trend lines - purple.
Le recensioni analitiche di InstaForex ti renderanno pienamente consapevole delle tendenze del mercato! Essendo un cliente InstaForex, ti viene fornito un gran numero di servizi gratuiti per il trading efficiente.

