 Rimani
Condizioni di trading
Strumenti


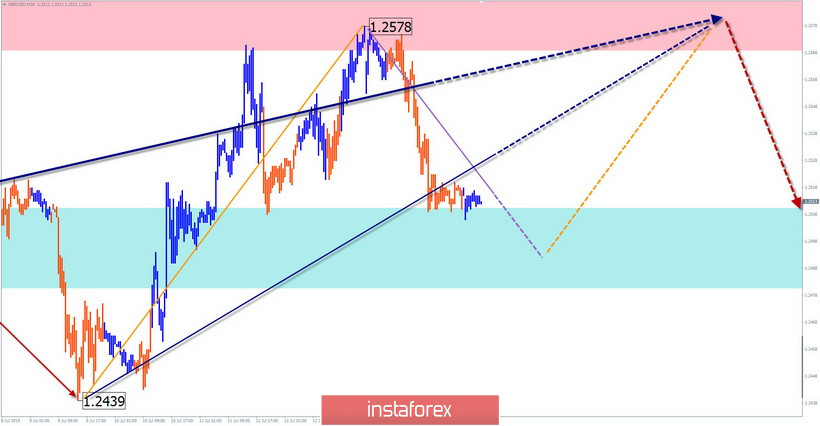
GBP/USD
The short-term trend of the British pound since March is directed to the "south" of the chart. The last unfinished plot is counting from June 25. Since July 5, a corrective rise has been developing in it. The price has reached the estimated completion zone, but there is no confirmation of the change of exchange rate yet. The decline that began yesterday has no reversal potential.
Forecast:
Today, we expect a general flat mood of price movements, with a dominant upward vector. Before the start of the rise, a short-term breakthrough of the support zone is not excluded, against the background of increased volatility of the pair.
Recommendations:
In the morning, sales of the pound will be ineffective. It is recommended to track the buy signals. After the price reaches the resistance zone, the conditions for selling the instrument may appear. Today, the correction of reversals with the release of news blocks is likely.
Resistance zone:
- 1.2570/1.2600
Support zone:
- 1.2510/1.2480
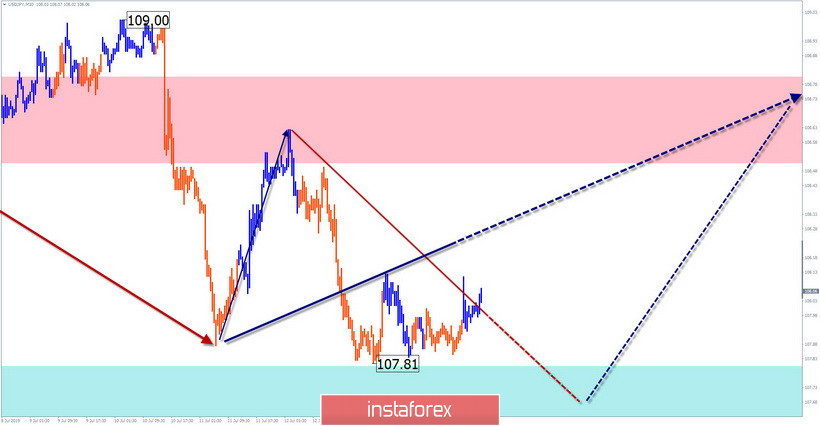
USD/JPY
Short-term price movements of the Japanese yen are set by the algorithm of the upward wave of June 21. The structure has a complex form, it completed the first 2 parts (A+B). The final part (C) started on July 11. It develops correction in the last 2 days.
Forecast:
During the current day, the completion of the downward phase of the movement, the formation of a reversal and the beginning of the price move up are expected. When changing the motion vector, a short-term puncture of the lower support boundary is not excluded. The resistance zone shows the expected upper limit of the daily course of the pair.
Recommendations:
When selling the yen, you should take into account the limited progress down. When the price reaches the support zone, it is recommended to monitor the signals of buying the pair.
Resistance zone:
- 108.50/108.80
Support zone:
- 107.80/107.50
USD/CHF
The rising wave, which began on June 25, has a high wave potential, allowing to classify it as a large-scale wave. The price decline that began on July 9 forms a full correction of the first part of the model.
Forecast:
Today, the overall flat mood of the price decline is expected, between the two opposing zones. Short-term price growth is possible at the next trading session, not beyond the resistance zone. Return to the bearish rate is most likely in the second half of the day.
Recommendations:
When buying today, it is more reasonable to reduce the lot and be ready to close the deal at the first signs of a price reversal. In the area of the resistance zone, it is recommended to monitor the pair's sell signals.
Resistance zone:
- 0.9870/0.9900
Support zone:
- 0.9810/0.9780
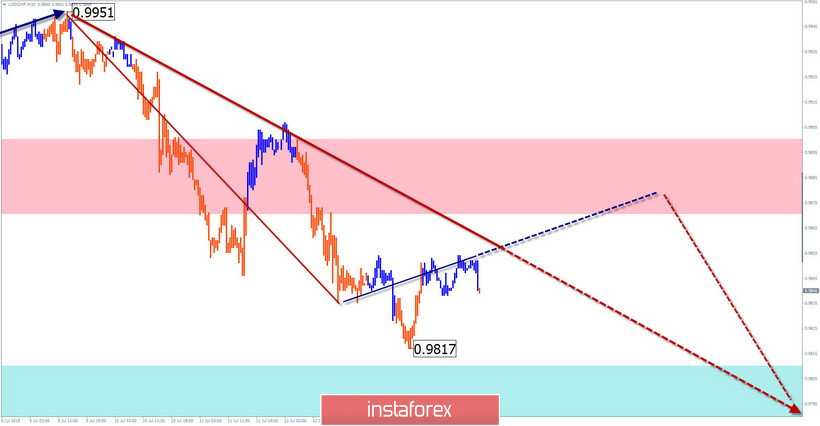
Explanations to the figures: Waves in the simplified wave analysis consist of 3 parts (A-B-C). The last unfinished wave is analyzed. Zones show areas with the highest probability of reversal. The arrows indicate the wave marking according to the method used by the author, the solid background is the formed structure, the dotted ones are the expected movements.
Note: The wave algorithm does not take into account the duration of tool movements over time.
Le recensioni analitiche di InstaForex ti renderanno pienamente consapevole delle tendenze del mercato! Essendo un cliente InstaForex, ti viene fornito un gran numero di servizi gratuiti per il trading efficiente.


