 Rimani
Condizioni di trading
Strumenti


GBP/USD
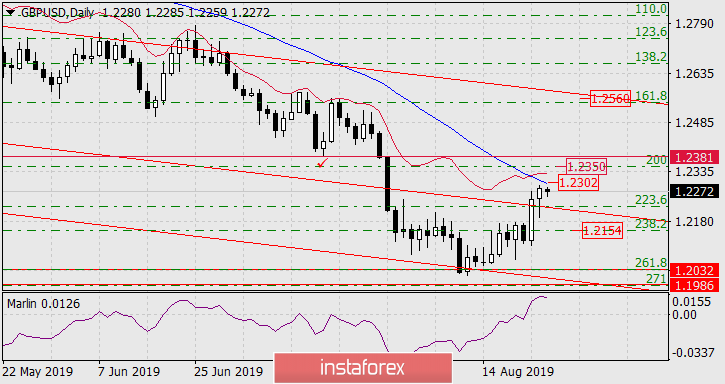
After overcoming the Fibonacci level of 223.6% on Thursday, the British pound continued to grow on Friday, approaching the MACD line on the daily scale chart. Today, in the Asian session, the price is slightly reduced and with it, the Marlin oscillator gave the first sign of a reversal. In the case of the price overcoming the MACD line (1.2302), growth is possible in the range of 1.2350/81 formed by the Fibonacci level of 200.0% and the low of July 17. Fixing above the range opens the way to more significant growth, to the Fibonacci level of 161.8%, it tends to the red line of the price channel (~ 1.2560).
On the four-hour chart, a slight divergence has formed on the Marlin oscillator, which indicates a possible delay before the probable growth in the range of 1.2350/81.
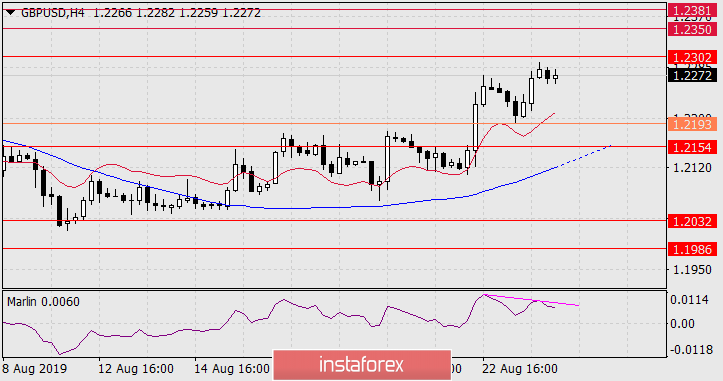
The first sign of a price reversal will be its departure at yesterday's low (1.2193), but for a full-fledged signal in the medium-term decline, it is necessary to fix the price under the MACD line at H4. Such a signal is likely in the area of the Fibonacci level of 238.2% on the daily chart (1.2154), to which this line tends.
Le recensioni analitiche di InstaForex ti renderanno pienamente consapevole delle tendenze del mercato! Essendo un cliente InstaForex, ti viene fornito un gran numero di servizi gratuiti per il trading efficiente.

