 Rimani
Condizioni di trading
Strumenti


4-hour timeframe
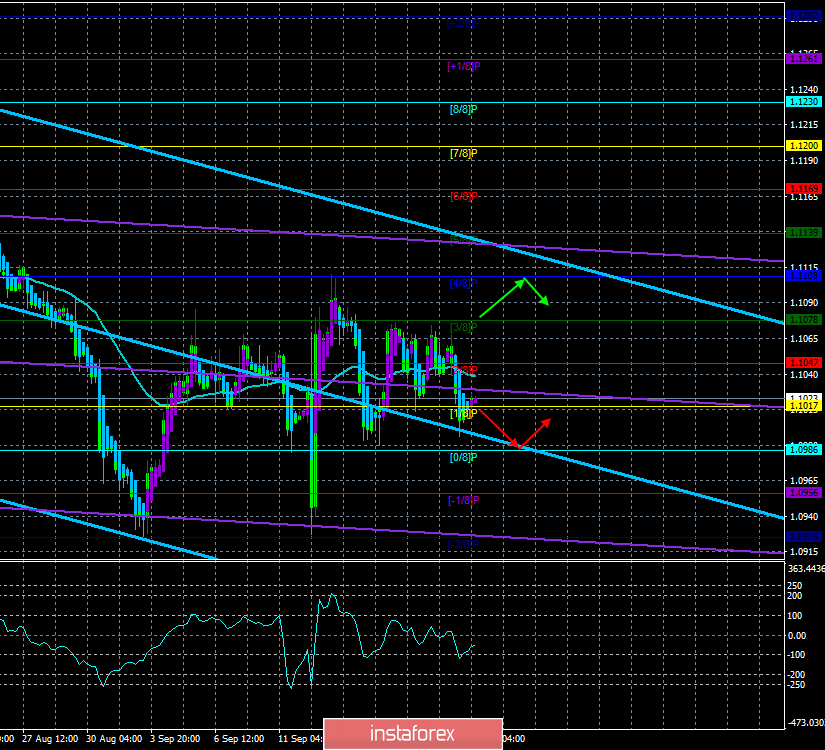
Technical data:
The upper channel of linear regression: direction – down.
The lower channel of linear regression: direction – down.
The moving average (20; smoothed) – sideways.
CCI: -50.9619
A new trading week for the EUR/USD currency pair begins with a flat, in which the pair stayed last week. However, today will not be "boring Monday", as it often happens. Traders will have to make a choice in which direction to move further and business activity indices in industry and the service sector will help with this choice, however, only preliminary values for September. In short, the situation is as follows: business activity in the manufacturing sector of the European Union has long been under the mark of 50.0, indicating a decline in the industry, and the same figure in the US is balancing on the verge of falling below the mark of 50.0. Thus, the key question for today is: has business activity in the US manufacturing sector decreased even more than in August? If so, the dollar may feel pressure on itself on September 23, as the rest of the business activity indices, although they may show a slowdown, are unlikely to be so strong as to go below 50.0. But, on the other hand, we are faced with a familiar phenomenon in the confrontation between the United States and the European Union. If in America, a certain indicator slows down or worsens, then in the European Union the same indicator, as a rule, has long been "at the bottom". Even if the US dollar will experience the pressure of the forex market, it is unlikely to be enough to get out of the side channel. If business activity in the industry exceeds the forecast and the figure of 50, it is quite possible to expect a new strengthening of the US dollar, which will allow the pair to exit the side channel and resume the downward trend. As you can see, the news for the European currency is bad again.
Thus, the prospects for the EU currency remain negative although the Fed still took a course on a systematic easing of monetary policy. However, nothing changes in terms of macroeconomic statistics. The US economy still looks much stronger than the European one. And if not for Trump with his trade wars, it would look even stronger. But even Donald Trump cannot influence the economy so much that it becomes weaker than the European one. Trump needs a "cheap" dollar, but for several years of his reign, he has not managed to achieve this goal. Bears on the euro/dollar pair can only hope that the US leader will not take seriously the solution of this issue.
The technical picture, as we have already said, assumes the further finding of the EUR/USD pair in the side channel. Both linear regression channels are downward, indicating a downward trend in the medium and long term. Bulls once again failed to develop their success and continue the upward movement after overcoming the moving average line. The reason – is the absence of a strong fundamental reason for this.
Nearest support levels:
S1 – 1.1017
S2 – 1.0986
S3 – 1.0956
Nearest resistance levels:
R1 – 1.1047
R2 – 1.1078
R3 – 1.1108
Trading recommendations:
The euro/dollar pair has fixed below the moving average but remains flat. Thus, we recommend waiting for the flat to finish, as the pair can repeatedly overcome the moving average line, which is directed sideways.
In addition to the technical picture, fundamental data and the time of their release should also be taken into account.
Explanation of illustrations:
The upper linear regression channel – the blue line of the unidirectional movement.
The lower linear regression channel – the purple line of the unidirectional movement.
CCI – the blue line in the indicator window.
The moving average (20; smoothed) – the blue line on the price chart.
Support and resistance – red horizontal lines.
Heiken Ashi – an indicator that colors bars in blue or purple.
Le recensioni analitiche di InstaForex ti renderanno pienamente consapevole delle tendenze del mercato! Essendo un cliente InstaForex, ti viene fornito un gran numero di servizi gratuiti per il trading efficiente.


