 Rimani
Condizioni di trading
Strumenti


Trend analysis (Fig. 1).
On Wednesday, the price may continue to move down to a pullback level of 61.8% - 1.2195 (red dashed line) again. From this level, it is possible to move up to the pullback level 38.2% - 1.2279 (blue dashed line).
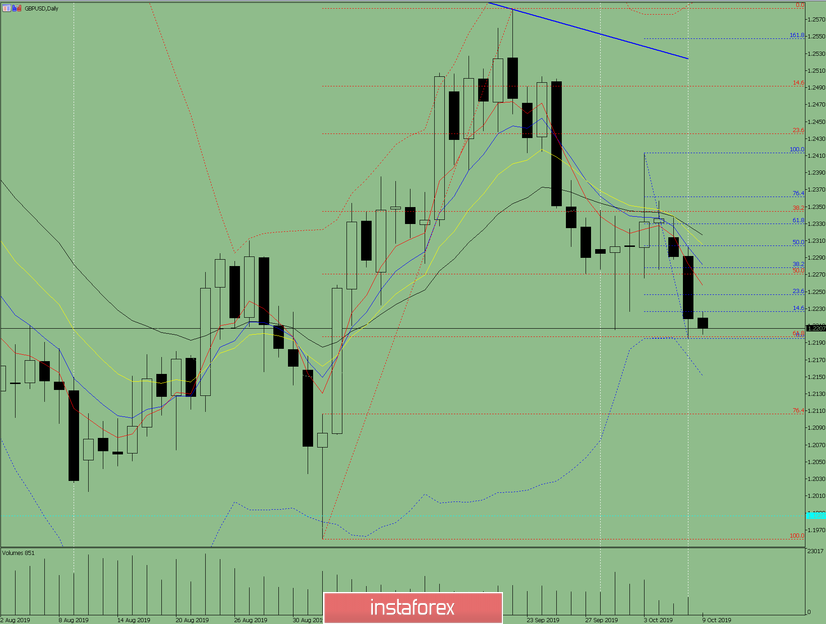
Fig. 1 (daily chart).
Comprehensive analysis:
- indicator analysis - up;
- Fibonacci levels - up;
- volumes - down;
- candlestick analysis - up;
- trend analysis - down;
- Bollinger Lines - down;
- weekly schedule - up.
General conclusion:
On Wednesday, the price may continue to move up.
At the beginning, we have the downward movement to the pullback level of 61.8% - 1.2195 (red dashed line), and then from this level, the upward movement with the target of 1.2279 - the pullback level of 38.2% (blue dashed line) is possible.
An unlikely scenario is from a pullback level of 61.8% - 1.2195 (red dashed line) moving down to the lower boundary of the Bollinger line indicator - 1.2153 (blue dashed line).
Le recensioni analitiche di InstaForex ti renderanno pienamente consapevole delle tendenze del mercato! Essendo un cliente InstaForex, ti viene fornito un gran numero di servizi gratuiti per il trading efficiente.

