 Rimani
Condizioni di trading
Strumenti


Trend analysis.
This week, the price will move down with the first target of 1.2608 – a retracement level of 38.2% (red dotted line). If achieved, the next target is 1.2483 – a retracement level of 50.0% (red dotted line).
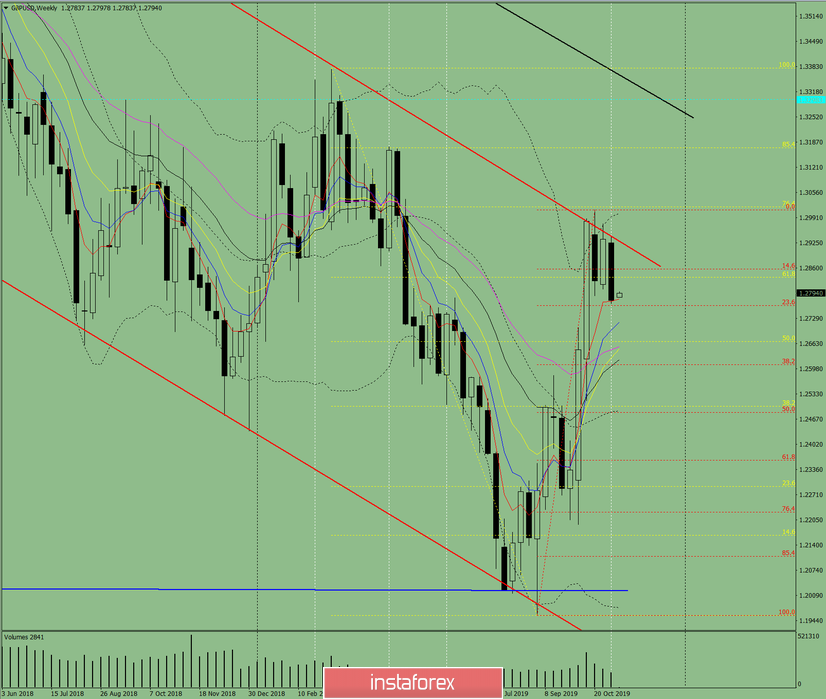
Fig. 1 (weekly chart).
Complex analysis:
- Indicator analysis – up;
- Fibonacci levels – down;
- Volumes – up;
- Candlestick analysis – down;
- Trend analysis – down;
- Bollinger bands – down;
- Monthly chart – down.
The conclusion of the complex analysis – a downward movement.
The overall result of calculating the candle of the GBP/USD currency pair according to the weekly chart: the price for weeks will most likely have a downward trend with the absence of the first upper shadow of the weekly black candlestick (Monday – down) and the absence of the second lower shadow (Friday – down).
The lower target of 1.2608 – a retracement level of 38.2% (red dotted line). If achieved, the next target is 1.2483 – a retracement level of 50.0% (red dotted line).
An unlikely scenario – from the level of 1.2784, work up with the target of 1.2925 – resistance line (red bold line).
Le recensioni analitiche di InstaForex ti renderanno pienamente consapevole delle tendenze del mercato! Essendo un cliente InstaForex, ti viene fornito un gran numero di servizi gratuiti per il trading efficiente.


