 Rimani
Condizioni di trading
Strumenti


Trend analysis (Fig. 1).
On Tuesday, the first lower target is a pullback level of 23.6% which is equivalent to 1.1065 presented in a blue dashed line. If successful, the next lower target 1.1049 is the retracement level of 38.2% presented in a blue dashed line. From the level of 1.1049, we can expect upper work with the target of 1.1091, the upper fractal presented in a blue dashed line.
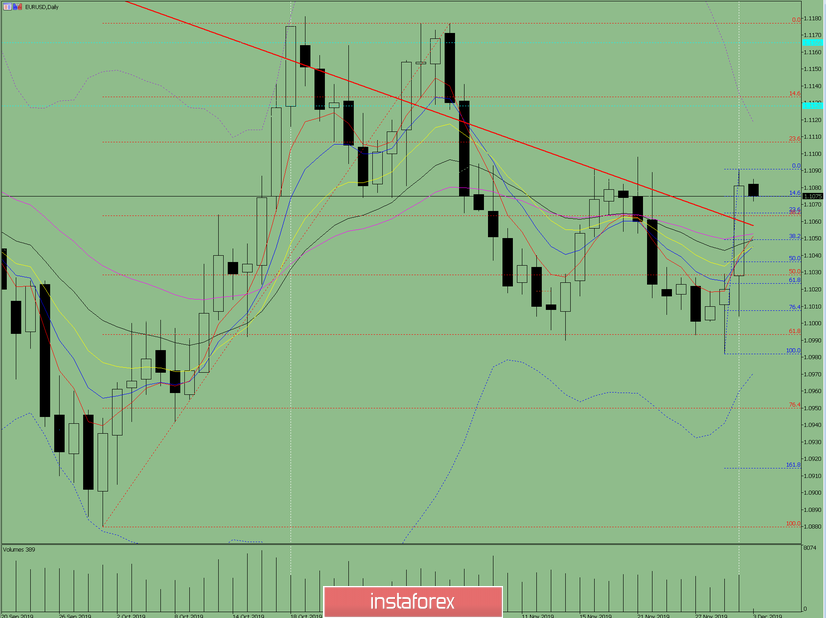
Fig. 1 (daily chart).
Comprehensive analysis:
- Indicator analysis - down;
- Fibonacci levels - down;
- Volumes - down;
- Candlestick analysis - down;
- Trend analysis - up;
- Bollinger Lines - up;
- Weekly schedule - up.
General conclusion:
On Tuesday, a pullback downward movement is possible.
The first lower target is the retreating level of 23.6% equivalent to 1.1065, presented in a blue dashed line. If successful, the next lower target 1.1049 is a retracement level of 23.6% presented in a blue dashed line. From the level of 1.1049, we can expect upper work with the target of 1.1091, the upper fractal in a blue dashed line. If the price does not fall below 1.1049, then we open up the market.
An unlikely, but possible scenario is a price fall down to a pullback level of 50% which is equivalent to 1.1037, presented in a blue dashed line.
Le recensioni analitiche di InstaForex ti renderanno pienamente consapevole delle tendenze del mercato! Essendo un cliente InstaForex, ti viene fornito un gran numero di servizi gratuiti per il trading efficiente.


