 Rimani
Condizioni di trading
Strumenti


According to the news, on Tuesday, the pair moved in the side channel instead of the bottom. Furthermore, the price almost tested the upper border of the Bollinger line indicator 1.1119, presented in a purple dashed line. However, after working out the news, the market went down by technical analysis and almost returned to its original position. Strong Thursday news is not expected today, also the market can test the pullback level 1.1065 and can continue to move up after moving down.
Trend analysis (Fig. 1).
On Thursday, the first lower target is a pullback level of 38.2% which is equivalent to 1.1065 presented in a blue dashed line. If this level is reached, we can expect upper work with the upper target 1.1117, the upper fractal in a blue dashed line. From the level of 1.1065, work down is unlikely, but possible with a lower target of 1.1049, a pullback level of 50% in a blue dotted line. From the level of 1.1049, again, only the upper work.
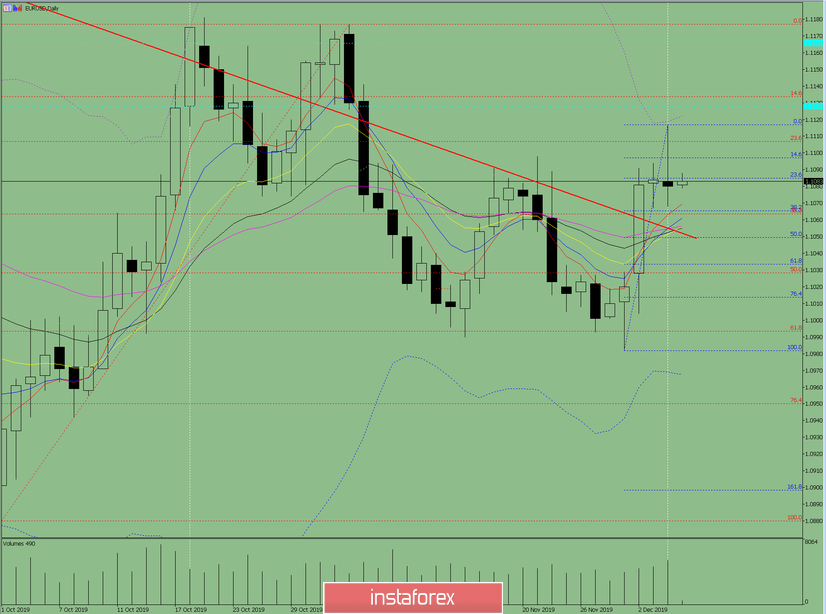
Fig. 1 (daily chart).
Comprehensive analysis:
- indicator analysis - up;
- Fibonacci levels - down;
- Volumes - up;
- Candlestick analysis - down;
- Trend analysis - up;
- Bollinger Lines - up;
- Weekly schedule - up.
General conclusion:
On Thursday, a pullback upward movement is possible. Also, the first lower target is a pullback level of 38.2% equivalent to 1.1065 presented in a blue dashed line. If this level is reached, we can expect upper work with the upper target 1.1117 which is the upper fractal in a blue dashed line. From the level of 1.1065, work down is unlikely, but possible with a lower target of 1.1049, a pullback level of 50% presented in a blue dotted line. Lastly, only upper work is possible from the level of 1.1049.
Le recensioni analitiche di InstaForex ti renderanno pienamente consapevole delle tendenze del mercato! Essendo un cliente InstaForex, ti viene fornito un gran numero di servizi gratuiti per il trading efficiente.


