 Rimani
Condizioni di trading
Strumenti


Trend analysis (Fig. 1).
On Thursday, after retesting the pullback level of 50% which is equivalent to 1.1146 presented in a blue dashed line, the price may go down and the first lower target is the pullback level of 14.6% equivalent to 1.1122 presented in a red dashed line. If successful, the next lower target 1.1107 is a retracement level of 23.6% presented in a red dashed line. Much will depend on the news that comes out at 12:45 and 13:30 Universal time.
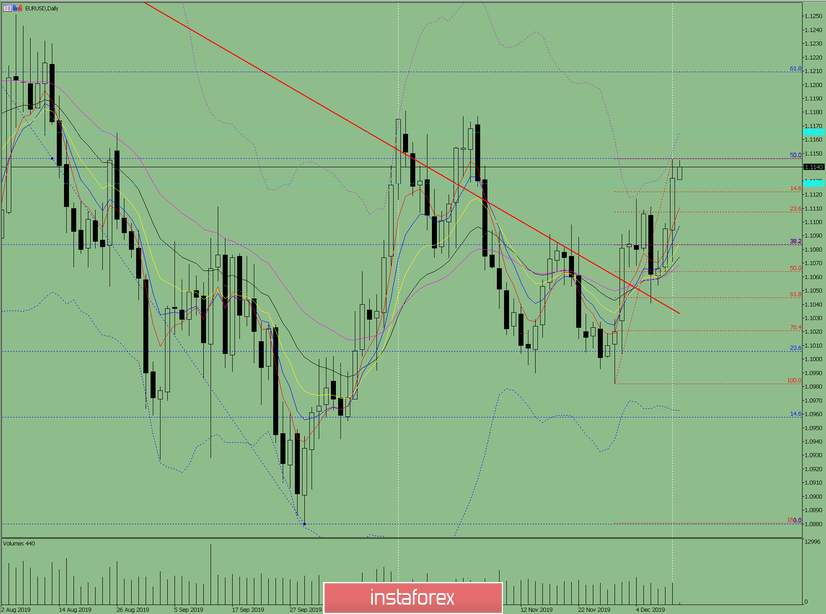
Fig. 1 (daily chart).
Comprehensive analysis:
- Indicator analysis - down;
- Fibonacci levels - down;
- Volumes - up;
- Candlestick analysis - down;
- Trend analysis - up;
- Bollinger Lines - up;
- Weekly schedule - up.
General conclusion:
On Thursday, after retesting the pullback level of 50% which is equivalent to 1.1146 presented in a blue dashed line, the price may go down and the first lower target is the pullback level of 14.6% equivalent to 1.1122 presented in a red dashed line. If successful, the next lower target 1.1107 is a retracement level of 23.6% presented in a red dashed line.
An unlikely scenario would be that the price goes up to the upper target 1.1165 which is the historical resistance level presented in a blue dashed line.
Le recensioni analitiche di InstaForex ti renderanno pienamente consapevole delle tendenze del mercato! Essendo un cliente InstaForex, ti viene fornito un gran numero di servizi gratuiti per il trading efficiente.


