 Rimani
Condizioni di trading
Strumenti


4-hour timeframe
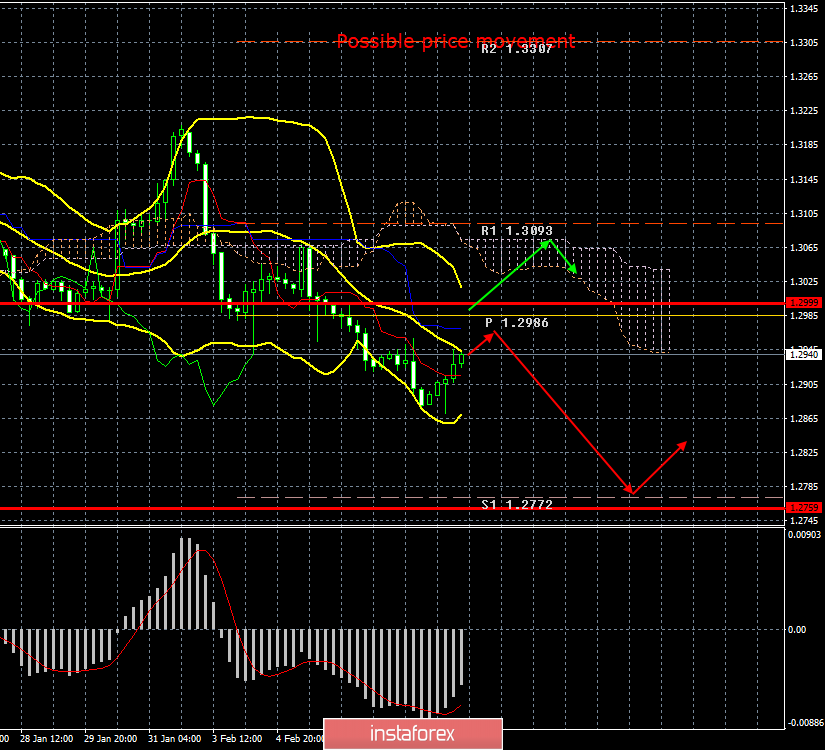
Amplitude of the last 5 days (high-low): 217p - 106p - 114p - 79p - 80p.
Average volatility over the past 5 days: 120p (high).
The pound sterling paired with the US currency on February 10 began a weak upward correction. We expected exactly the same development of events from the EUR/USD pair, but only the pound/dollar pair began to adjust. Although, from our point of view, the British currency is generally quite overbought, despite the fact that in recent years it has only become cheaper. The first trading day was rather boring and uninteresting, since no macroeconomic publications were planned for that day. Thus, traders decided to consolidate part of the position before an extremely important Tuesday, when a large amount of important macroeconomic information will be published. By and large, the pound will depend on tomorrow. If, on the whole, macroeconomic statistics turn out to be at least not a failure, then perhaps the upward correction will continue. There is very little hope of Jerome Powell in Congress. It is unlikely that out of the blue, following strong reports on the US labor market, the Fed chief will change his rhetoric to a dovish one. Thus, Powell's speech at best will simply not trigger new purchases of the US dollar.
But it is extremely difficult to expect the same effect from UK statistics. In principle, only one indicator of GDP is enough, which according to preliminary estimates should slow down from 1.1% to 0.8% in the fourth quarter. Of course, GDP can be, for example, 1.0%, which will still be worse than the previous value and above the forecast. Traders can decide that not everything is so bad, and not continue to sell the pound. Thus, it is not a fact that tomorrow we will definitely see a fall in the British currency. But all market participants are well aware that in the long term, the pound will still be subject to decline, since nothing in the UK is changing for the better. All risks relating to Brexit remain. All risks relating to negotiations with the European Union on a trade agreement remain. The economy continues to lose money. What will happen after 2020 is not known at all. Thus, our forecasts for the whole of 2020 remain the same - a fall and only a fall. It may not be a landslide, it may not be panic, it may not be quick, but it will fall.
What to expect from a currency pair in technical terms? First, the movement to the critical line. If the pair reaches this line and bounces off it, then the downward movement will resume, and traders will receive an eloquent signal for selling the pound sterling. Secondly, the preservation of a long-term downward movement, as on the 24-hour chart Bollinger bands began to expand downward, which indicates the completion of a 5-month upward trend.
Trading recommendations:
GBP/USD began to adjust against the "dead cross". Thus, selling the pound with the target support level of 1.2772 is still relevant, but after the completion of the current correction, which can be determined by the rebound from the Kijun-sen line or by turning the MACD indicator down. Purchases of a pair by small lots can be considered if the price returns to the area above the Kijun-sen line with the first goal of the Senkou Span B. line
Explanation of the illustration:
Ichimoku indicator:
Tenkan-sen is the red line.
Kijun-sen is the blue line.
Senkou Span A - light brown dotted line.
Senkou Span B - light purple dashed line.
Chikou Span - green line.
Bollinger Bands Indicator:
3 yellow lines.
MACD indicator:
Red line and bar graph with white bars in the indicators window.
Support / Resistance Classic Levels:
Red and gray dashed lines with price symbols.
Pivot Level:
Yellow solid line.
Volatility Support / Resistance Levels:
Gray dotted lines without price designations.
Possible price movements:
Red and green arrows.
Le recensioni analitiche di InstaForex ti renderanno pienamente consapevole delle tendenze del mercato! Essendo un cliente InstaForex, ti viene fornito un gran numero di servizi gratuiti per il trading efficiente.


