 Rimani
Condizioni di trading
Strumenti


Bitcoin as expected from our previous analysis has broken the bullish short-term channel and is now challenging the $60,000 support level. Despite making a new all time high above $65,000, the RSI provided a bearish divergence and we noted that bulls needed to be cautious as a pull back was justified.
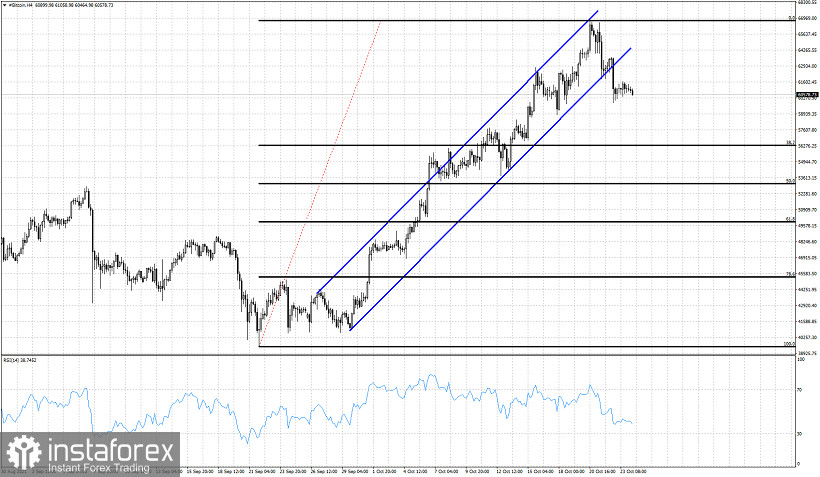
Black lines- Fibonacci retracement levels
Bitcoin is vulnerable to a move lower towards the 38% Fibonacci retracement. Having broken the bullish channel it was in has provided us with a bearish signal. This does not mean that the recent high is a major top. However in the near term price is vulnerable to the downside. A pull back towards $55,000 or even $50,000 is justified in order for bulls to gather momentum by creating a higher low before the next attempt to break above $65,000.
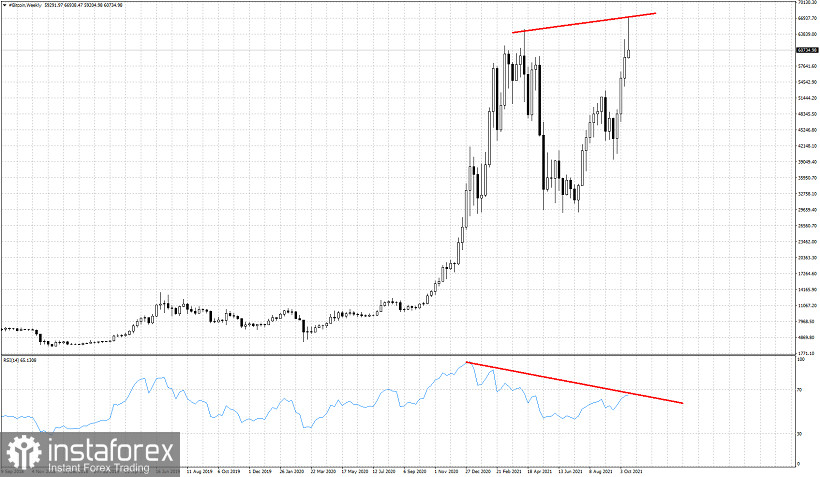
On a weekly basis price is forming a reversal candlestick pattern and the RSI is providing a bearish divergence. Although both are not sell signals, they provide a major warning of what could come. Bulls need to be cautious and patient. The closer the weekly close will be to $49,500, the more bearish the candlestick will be. Bulls do not want to see a long upper shadow in the daily candlestick.
Le recensioni analitiche di InstaForex ti renderanno pienamente consapevole delle tendenze del mercato! Essendo un cliente InstaForex, ti viene fornito un gran numero di servizi gratuiti per il trading efficiente.


