 Rimani
Condizioni di trading
Strumenti


4-hour timeframe
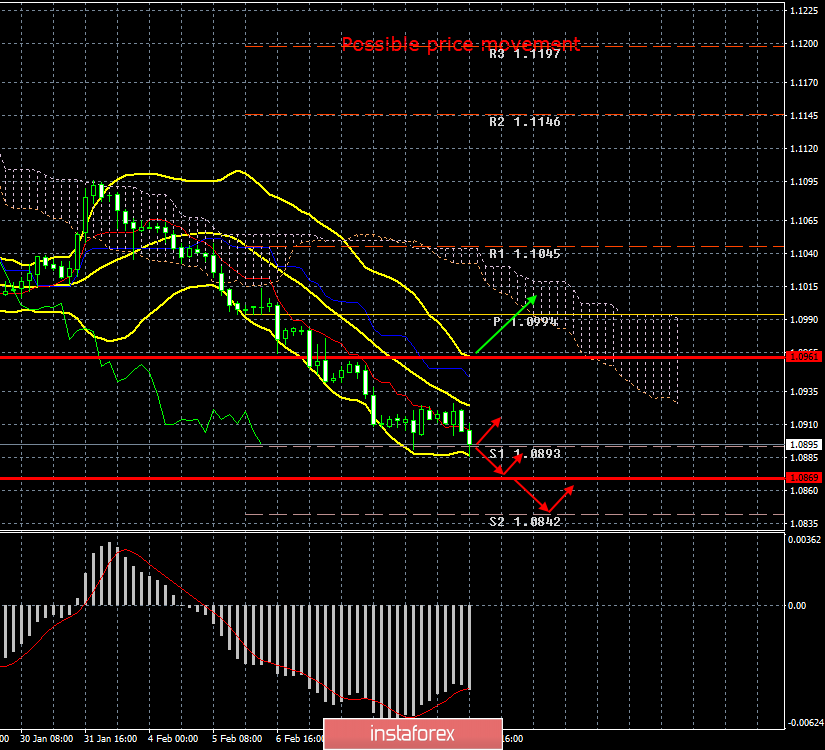
Amplitude of the last 5 days (high-low): 50p - 43p - 43p - 49p - 34p.
Average volatility over the past 5 days: 46p (average).
The EUR/USD currency pair resumed the downward movement on Wednesday, February 12, even without a minimal correction (!!!). There was simply no correction after a six-day continuous fall. The pair stood at the same place most of the night and day trading, and at the US trading session it resumed its downward movement, updated the previous local low, once again worked out the support level of 1.0893. These are the results of the third trading day of the week. We can immediately note that there was no reaction from market participants - neither to yesterday's speech by Jerome Powell, nor to Christine Lagarde's from today. In fact, the heads of central banks did not inform the traders of anything new. Thus, in fact, there was nothing to react to. Thus, no changes in the monetary policies of the ECB and the Fed in the near future are still not expected, and traders are still encouraged to pay increased attention to macroeconomic reports from the eurozone and the United States.
Only one macroeconomic report has been published today. We are talking about industrial production in the European Union. Its value decreased from -1.5% in November to -4.1% yoy in December 2019. In monthly terms, industrial production decreased by 2.1%, while a month earlier an increase of 0.2% was recorded. Forecasts on these indicators were naturally higher, but they were not destined to come true. Thus, we got 14 consecutive months, when industrial production in the EU fell, and also the decline in December was a record for all these 14 months. In monthly terms, we have the largest volume decline in the last 23 months. Despite the fact that this indicator still does not have such a serious impact on the euro exchange rate, such as inflation or GDP, with values that will clearly negatively affect the same GDP, a more serious fall in the European currency could be expected. However, while traders are near two-year lows, the probability of a rebound from the level of 1.0879 and the beginning of an upward trend remains. Just because the bears may again stop selling the euro, for fear of too low price values for the EUR/USD pair. Thus, since the signal for correction was, but was offset (a rebound from the level of 1.0893 yesterday), you can still sell the pair, however, remember that an unexpected upward movement of the pair may occur around the level of 1.0879, even if it will not be substantiated from a macroeconomic point of view.
Meanwhile, US presidential elections are approaching, and various research institutes continue to calculate the likelihood of Trump being re-elected to them. According to another study by the University of Monmouth, 66% of US voters believe that Donald Trump will win the upcoming elections. However, only 42% believe that he should be re-elected for a second term. In other words, Trump's support is now at 42-45%, but most Americans believe that the president will stay for a second term. U.S. elections are becoming more like the British prime minister's election last summer or the MP elections this winter. By and large, here and there there is one odious charismatic applicant, who is criticized a lot, but who is constantly in sight, constantly flashes in the media, in social networks, constantly differs in resonant actions and statements. What do you, dear traders, remember, for example, Joe Biden? In addition, it was precisely because of him that the process of impeachment of Trump began, which, in fact, the incumbent president won. In general, it is difficult to say who will win the US election, but if we were asked who would win, then we would also bet on Donald Trump.
From a technical point of view, the downward movement continues, and the signs of correction all evaporated. A new rebound from the level of 1.0893 may again provoke a rise in the price of the euro, however, given the current macroeconomic statistics from the eurozone, it will be difficult for traders to find reasons for buying the euro.
Trading recommendations:
EUR/USD continues to move down. Thus, it is now recommended that you keep selling the euro while aiming for 1,0893, 1,0869 and 1,0842. An increase from any of these levels will allow you to close sell positions. It will be possible to consider purchases of the euro/dollar pair in small lots with the goal of the Senkou Span B line, if traders manage to gain a foothold above the Kijun-sen line, which is not expected in the near future.
Explanation of the illustration:
Ichimoku indicator:
Tenkan-sen is the red line.
Kijun-sen is the blue line.
Senkou Span A - light brown dotted line.
Senkou Span B - light purple dashed line.
Chikou Span - green line.
Bollinger Bands Indicator:
3 yellow lines.
MACD indicator:
Red line and bar graph with white bars in the indicators window.
Support / Resistance Classic Levels:
Red and gray dashed lines with price symbols.
Pivot Level:
Yellow solid line.
Volatility Support / Resistance Levels:
Gray dotted lines without price designations.
Possible price movements:
Red and green arrows.
Le recensioni analitiche di InstaForex ti renderanno pienamente consapevole delle tendenze del mercato! Essendo un cliente InstaForex, ti viene fornito un gran numero di servizi gratuiti per il trading efficiente.

