 Rimani
Condizioni di trading
Strumenti


Hello, dear colleagues!
At the end of the past week, the price dynamics of the main currencies against the US dollar was diverse - some strengthened, others showed a decrease.
In particular, the EUR/USD currency pair again showed a decline, which amounted to 0.98%. Pretty impressive, isn't it?
Against the backdrop of the ongoing coronavirus epidemic, the US dollar is getting support, and the EUR/USD pair has not been at the current low levels for about four years. Some experts believe that the strengthening of the US currency will increase even more and we will see a strong upward trend for the US dollar. Others believe that the situation will soon change and the US currency will begin to weaken. I think you should not make far-reaching assumptions, a lot will depend on various important factors. For example, from the monetary policy of the Federal Reserve System (FRS). No less (and often more) information can be obtained when analyzing price charts, to which I suggest moving.
Weekly
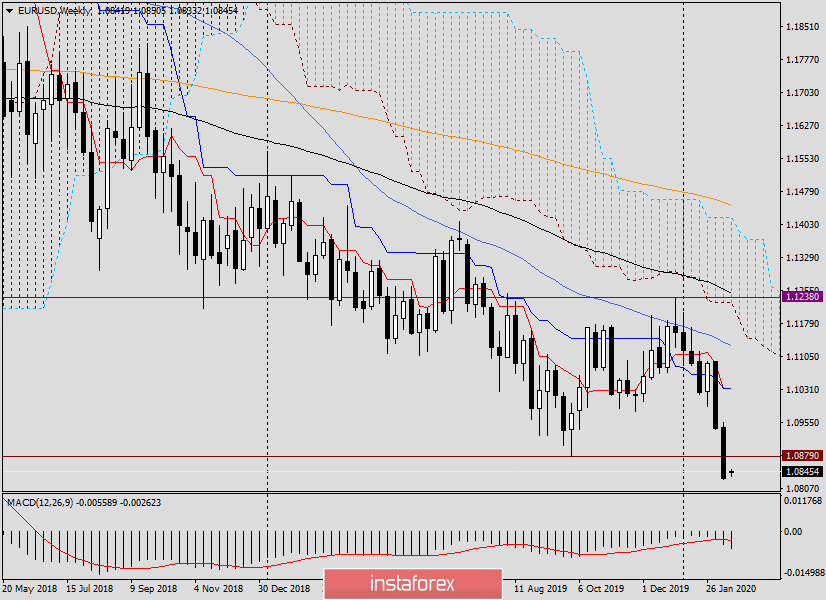
After the breakdown of the significant support level of 1.0879, the chances of a further and stronger continuation of the downward trend became even greater. But is it possible to judge the truth of the breakdown of this level by one closed weekly candle?
If the euro/dollar manages to show an increase this week, and the auction ends above 1.0879, the breakdown of this mark will have to be considered false. In an alternative scenario, the pair will continue to fall, and in this case, the nearest target will be 1.0680, and then 1.0570.
Thus, EUR/USD is facing another extremely important week. The euro bulls still have chances to correct the situation and make at least a rate adjustment. To do this, as already noted, trading on February 17-21 must be closed above 1.0879. Otherwise, the bears will continue their pressure on the quote in the area of the above targets. At the same time, it is necessary to take into account the correction option in the side range.
Daily
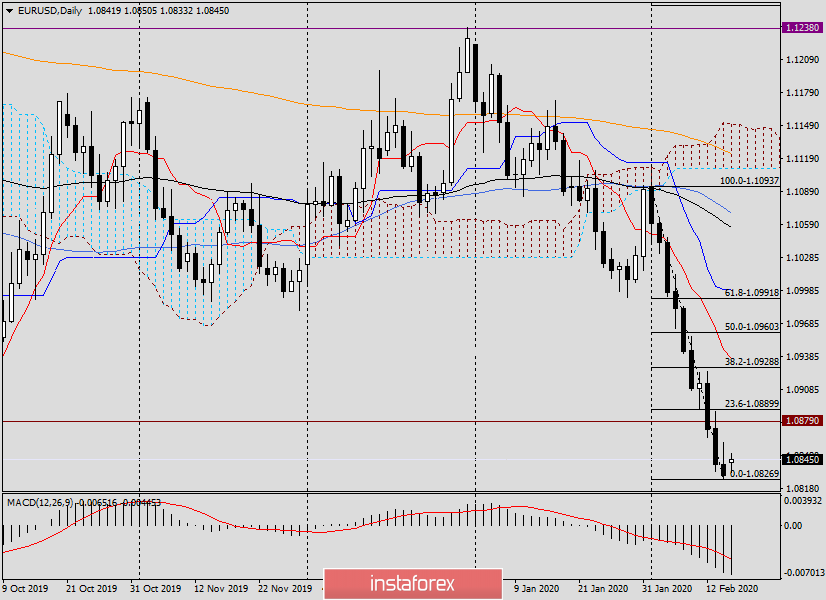
As seen on the daily chart, I stretched the Fibonacci grid for a drop from 1.1094 to 1.0827. The candle that appeared on February 14 signals the probability of an upward turn. As experience shows, this is often the case after such candles.
At the moment of writing, the pair is showing moderate growth. If you take into account the Friday candle and count on a corrective rise, then its first goal will be the mark of 1.0890, where the level of 23.6 Fibo passes from the specified decline.
If we take into account the strength of the downward trend and the proximity to the 23.6 Fibo of the broken support level of 1.0879, it is too early to talk about further goals for a possible correction. Usually, after such an intense and rapid price movement, the correction is limited to the first pullback level of 23.6 Fibo or even a side range at all.
Thus, it can be assumed that the area of 1.0870-1.0900 looks technically justified for opening short positions on the euro/dollar. With a deeper correction, the pair will go to the next level of 38.2 Fibo, which is located at the price value of 1.0929, slightly higher at 1.0937, the Tenkan line of the Ichimoku indicator passes. The second price zone for selling the pair can be considered 1.0927-1.0937.
In my opinion, the best scenario for sales is the first one. By the way, technically, the mark of 1.0900 is very strong, and you can see this by viewing the history. The fact is that even if the price falls above 1.0900, there are levels such as 1.0930, 1.0960 and 1.0980, which have repeatedly had a strong impact on the movement of the price rate.
This week is expected to publish numerous macroeconomic data from Europe and the United States, which can be found in more detail by looking at the economic calendar. However, in my opinion, the main event of this week will be the publication of the minutes of the last FOMC meeting. The minutes will be published on Wednesday, at 20:00 (London time).
If we return to the technical component, tomorrow we will look at smaller timeframes and try to find acceptable entry points to the market. And at the moment, we are waiting for a correction in the area of 1.0870-1.0900 for sales. And risky and aggressive traders can try buying right now on the market. At the end of the review, the euro/dollar is trading at 1.0846.
Good luck!
Le recensioni analitiche di InstaForex ti renderanno pienamente consapevole delle tendenze del mercato! Essendo un cliente InstaForex, ti viene fornito un gran numero di servizi gratuiti per il trading efficiente.


