 Rimani
Condizioni di trading
Strumenti


Hello!
Perhaps the main driver that affects the price dynamics of the euro/pound pair's rate is still Brexit. More specifically, this is a deal on a trade agreement between the UK and the EU.
Optimism after the victory of the Conservative is fading. We can assume that this event has already been played by the market.
As for the monetary policy of the Bank of England, many market participants expect that this year the British Central Bank will go to the easing of monetary policy and reduce the main interest rate. Some speculate that this will happen at the meeting of the Bank of England in May.
Such assumptions, along with sluggish economic growth in the UK, are not in favor of the pound and paired with the euro in particular.
Let's look at the price charts of this interesting pair's rate. As a rule, you can get a lot of information from them and understand the prospects for the further direction of a particular tool.
Weekly
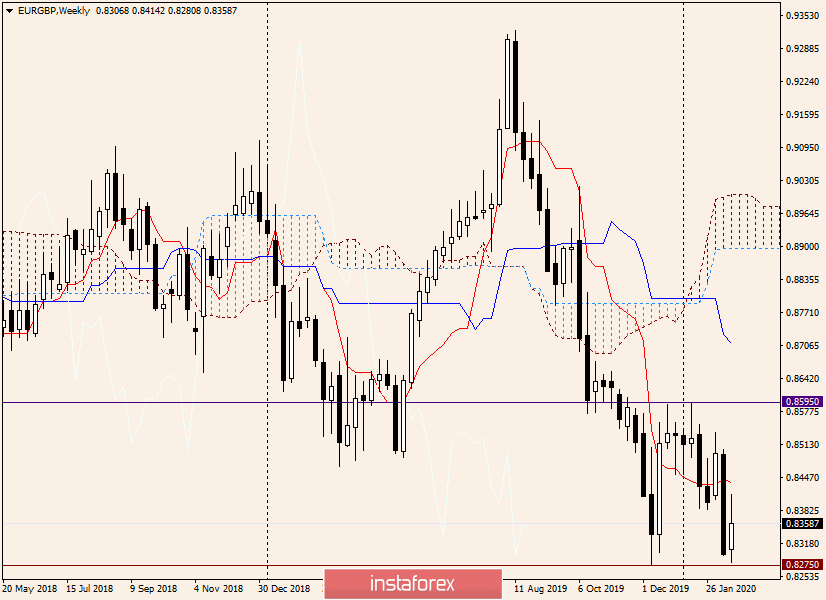
The range in which the euro/pound has been trading for a long time can be designated as 0.8275-0.8595. In this regard, it is logical to assume that the exit from this range will indicate the direction of the price movement of EUR/GBP in the medium term.
Last week, the cross declined significantly. Moreover, on the current five-day trading week, the euro/pound shows the growth that can be estimated as quite restrained. The pair met strong resistance near 0.8400, then rebounded. At the time of writing, it is trading near 0.8370.
If you look closely, this week opened higher than the previous one ended. At the moment, the current candle can be characterized as "Harami" since it is located inside the body of the previous large black candle.
If everything remains approximately the same, then the reversal candlestick pattern at the lower end of the range can be perceived as a signal to buy. If the Tenkan line of the Ichimoku indicator is passed, the bullish sentiment for this cross-rate will increase, and the next targets will be the psychological level of 0.8500 and the mark of 0.8530. I would like to pay special attention to the resistance of sellers - 0.8595. If the pair can rise to this level, we will most likely see it break through and consolidate above 0.8600. In this case, the market for EUR/GBP can be considered bullish and wait for the continuation of growth, the goals of which will be 0.8700, 0.8800 and 0.8840. The cross may reach a very important level of 0.8900, where you can expect a reversal for a correction or a change in the trend.
Daily
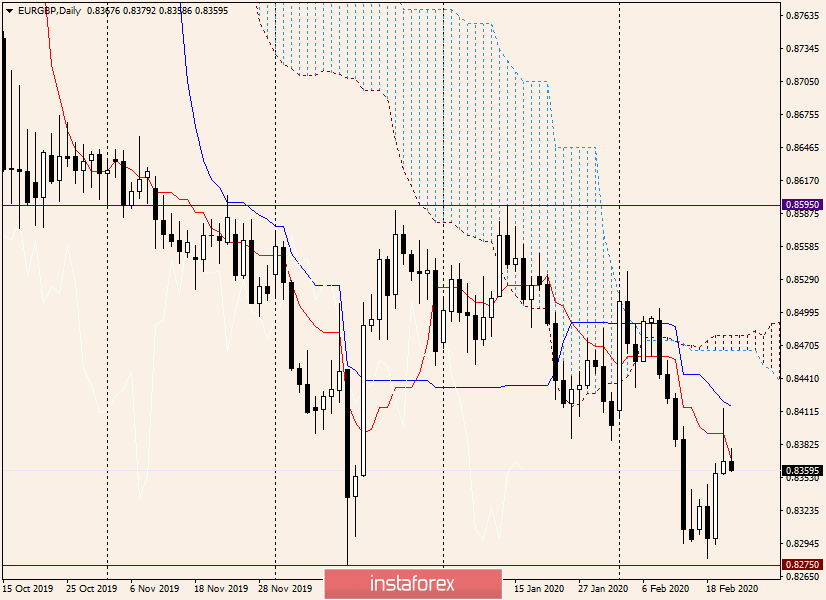
In this timeframe, the picture is twofold. After a good growth on February 19, yesterday we could hope for a continuation of the rise. However, after rising to 0.8414, the pair began to lose upward momentum, and as a result, a candle with a huge upper shadow and a small bullish body was formed.
Such a model can be classified as a "Tombstone", and if it appeared at the end of the upward movement, it would be a good signal for opening sales.
As you can see, the Tenkan and Kijun lines of the Ichimoku indicator also affected the price movement, providing resistance to the quote.
From my point of view, only fixing above 0.8416, where Kijun is located, will give a signal to continue rising to 0.8465, where the border of the Ichimoku cloud passes. The longer-term goals for possible growth have already been mentioned above when describing the weekly timeframe.
If we talk about the downward scenario and the goals at the bottom, these are 0.8356, 0.8295 and 0.8275. A breakdown of the last level and consolidation below will clearly indicate bearish sentiment at the euro/pound cross rate.
In my personal opinion, at the moment, the pair has a better chance of strengthening. However, this will only happen if the bulls on the instrument manage to gain a foothold above 0.8416.
Good luck!
Le recensioni analitiche di InstaForex ti renderanno pienamente consapevole delle tendenze del mercato! Essendo un cliente InstaForex, ti viene fornito un gran numero di servizi gratuiti per il trading efficiente.


