 Rimani
Condizioni di trading
Strumenti


4-hour timeframe
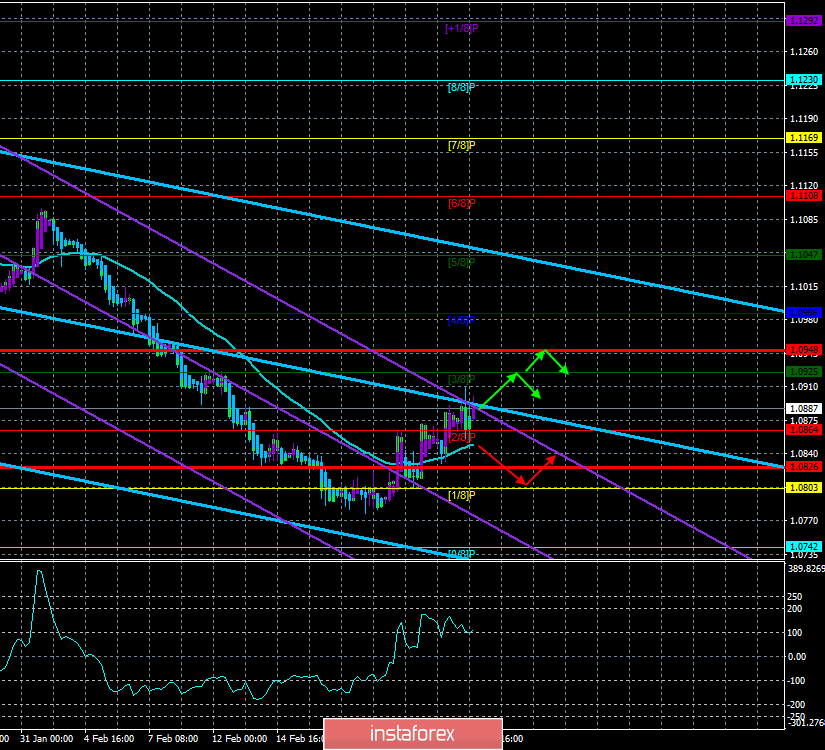
Technical details:
Higher linear regression channel: direction - downward.
Lower linear regression channel: direction - downward.
Moving average (20; smoothed) - sideways.
CCI: 113.1585
On February 27, the European currency paired with the US dollar starts with the same weak upward correction movement. The price is still above the moving average, so the upward movement retains its prospects. On Wednesday, nothing out of the ordinary happened for the EUR/USD pair. Therefore, the pair was moving extremely prosaic. Although the fundamental background is empty, the volatility of the euro is quite high. However, the absence of any interesting events in the economic world contributes to the withdrawal of traders from the market. So far, we can say that everything is going according to the corrective plan.
After three empty days in terms of macroeconomic statistics, traders will finally have something to pay attention to. I would like to note that the entire block of statistics today can be divided into two groups: (1) European reports, which are statistical and are unlikely to cause any market reaction; (2) American reports, which are important and are likely to cause a market reaction. Among the seven publications in the EU today, we can distinguish two of the most significant.
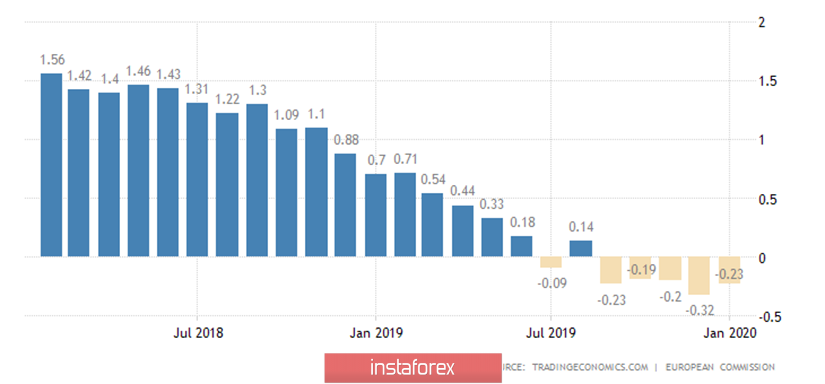
First - the business climate indicator for February, which is based on surveys and evaluates the current conditions for doing business in the European Union. As you can see, based on the graph, this indicator has been falling for the past two years, which coincides with a drop in industrial production and a slowdown in GDP. Forecasts for February are not comforting. It is expected to further reduce the indicator from the current -0.23 to -0.28.
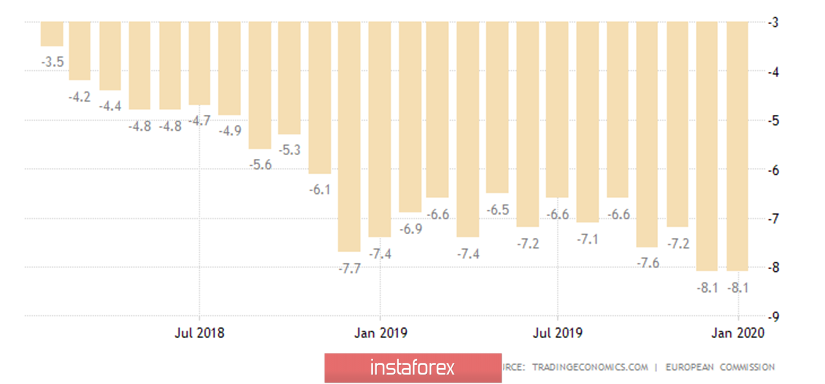
Second - the level of consumer confidence, which reflects the mood among consumers and their confidence in the current economic situation. Here the graph is even more eloquent. Over the past two years, the indicator has been firmly stuck in the negative zone and there is no reason to assume its rapid exit from it. The forecast for February is -6.6. Thus, we see that even if these indices were important for traders, they would still not support the European currency.
Thus, market participants will have to pay all their attention today to the data that will come from overseas. In the United States, orders for durable goods and its three variations will be published today: excluding defense and transportation orders. Also, the fourth-quarter GDP in the United States will be published according to preliminary estimates, the price index of GDP, as well as the number of new applications for unemployment benefits. The most important data will be discussed with charts in the article on GBP/USD. Here we can say that the forecasts for all indicators are versatile. First of all, it is very difficult to predict what will be the actual values of the reports. And secondly, what will be the reaction of traders if, for example, two of the four reports on orders are higher than forecasts, and two are lower. Given the fact that the euro continues to balance on the verge of not resuming the downward trend, it needs weak statistics from overseas.
From a technical point of view, the euro/dollar pair continues to trade just above the moving average, and since there will be very few important macroeconomic statistics this week, nothing should lead the pair off the corrective path. However, once again we warn traders that the bulls remain extremely weak and do not have any fundamental support. However, after such a strong fall in the euro in recent weeks, a correction is still vital. And it is unlikely that it will be "fast". Most likely, it will take several weeks. However, you should also be prepared for the resumption of the downward trend. We have repeatedly said that all the trumps remain in the hands of the US dollar and it will strive for price parity with the euro in 2020.
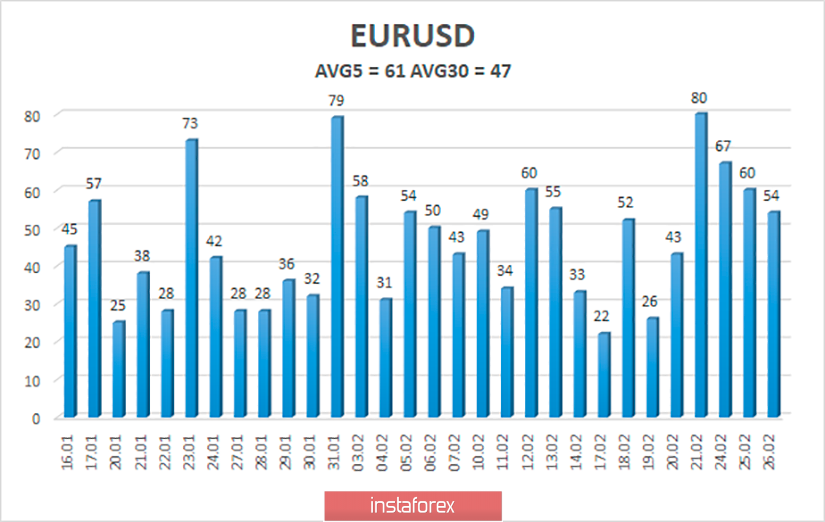
The average volatility of the euro/dollar currency pair is currently 61 points per day. The volatility indicator continues to grow. However, given the weak macroeconomic background this week, this process may stop very soon. Thus, on Wednesday, we expect movement between the borders of the volatility corridor of 1.0826-1.0948. A reversal of the Heiken Ashi indicator to the top will indicate a new round of upward movement.
Nearest support levels:
S1 - 1.0864
S2 - 1.0803
S3 - 1.0742
Nearest resistance levels:
R1 - 1.0925
R2 - 1.0986
R3 - 1.1047
Trading recommendations:
The euro/dollar pair continues its corrective movement, formally - an upward trend. Thus, purchases of the European currency with the targets of 1.0925 and 1.0948 are relevant now since both channels of linear regression are directed downwards. You can return to sell positions after the price is fixed below the moving average line with the first targets of 1.0803 and 1.0742.
In addition to the technical picture, you should also take into account the fundamental data and the time of their release.
Explanation of the illustrations:
The highest linear regression channel is the blue unidirectional lines.
The lowest linear regression channel is the purple unidirectional lines.
CCI - blue line in the indicator window.
Moving average (20; smoothed) - blue line on the price chart.
Murray levels - multi-colored horizontal stripes.
Heiken Ashi is an indicator that colors bars in blue or purple.
Possible variants of the price movement:
Red and green arrows.
Le recensioni analitiche di InstaForex ti renderanno pienamente consapevole delle tendenze del mercato! Essendo un cliente InstaForex, ti viene fornito un gran numero di servizi gratuiti per il trading efficiente.


