 Rimani
Condizioni di trading
Strumenti


The price of GBP/USD in March continued to move downwards, testing the support line of the descending channel, 1.1411 (red bold line). Unfortunately, the attempts to break through this line were unsuccessful. Nevertheless, thanks to fundamental analysis, after rebounding from the support line, the price rallied upwards, almost testing the 50% pullback level- 1.2461 (red dotted line).
Trend analysis:
There is a possibility that in April, the downward movement will continue, and its goal will be the pullback level of 38.2%, 1.2044 (blue dotted line). If this level is exceeded, the next lower target will be the pullback level of 50.0% - 1.1922 (blue dotted line).
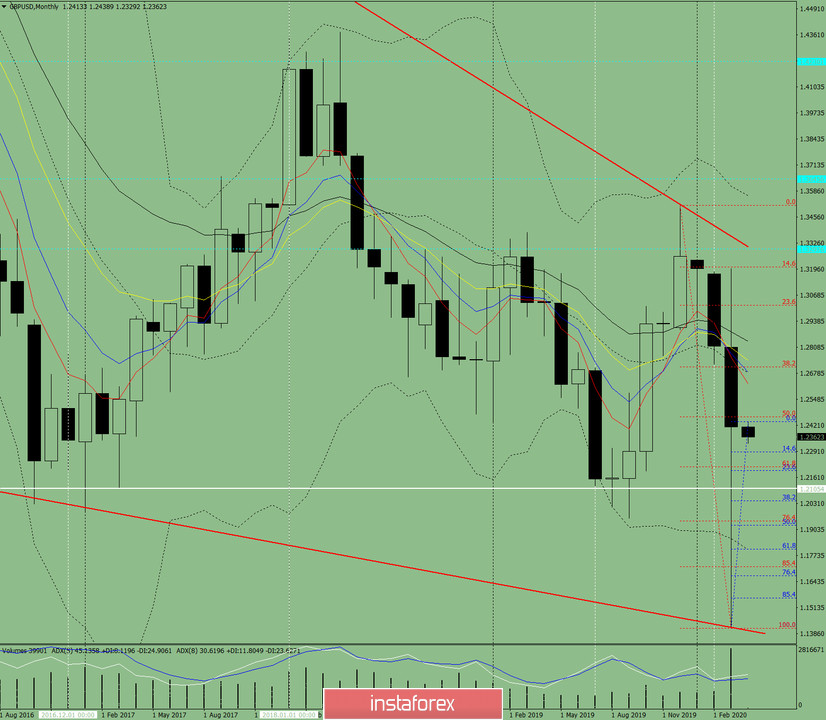
Fig. 1 (monthly chart).
- Indicator analysis:
- Indicator analysis - down;
- Fibonacci levels - down;
- Volumes - down;
- Technical analysis – down;
- Trend analysis - down;
- Bollinger bands - down;
Conclusion: possible bottom.
Calculating all the GBP/USD candles in the monthly chart: the price will likely have a downward trend, with the absence of the first upper shadow (first week of the month) in the black monthly candles and the absence of the second lower shadow (last week of the month).
Lower target: 1.1922 – 61.8% pullback level (blue dotted line).
An unlikely scenario: from 1.2287 - 14.6% pull back level (blue dotted line), the movement of the price will turn upwards, with the target at the resistance of 1.3304 (red bold line).
Le recensioni analitiche di InstaForex ti renderanno pienamente consapevole delle tendenze del mercato! Essendo un cliente InstaForex, ti viene fornito un gran numero di servizi gratuiti per il trading efficiente.

