 Rimani
Condizioni di trading
Strumenti


To open long positions on EURUSD, you need:
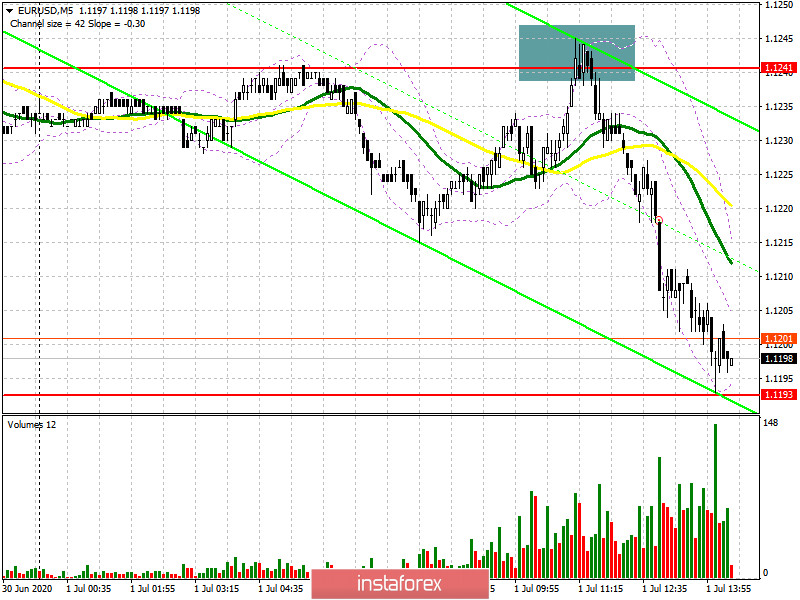
Euro buyers liked the data released on the manufacturing activity of the eurozone countries, as well as on Germany's retail trade, as they turned out to be better than economists' forecasts, however, they failed to achieve a breakdown level of 1.1241. As a result, a sell signal was formed, which I discussed in more detail in my morning forecast. If you look at the 5-minute chart, you will see how bears form a false breakout at the resistance level of 1.2141 and then quickly return the pair to the support of 1.1193, where they exit the market. This can be seen in the largest volume spike of the day. At the moment, the task of buyers of the euro remains to protect the level of 1.1193, since a lot depends on it. Only the formation of a false breakout will be a signal to open long positions in EUR/USD. With a second decrease to this area and the absence of activity on it, it is best to postpone long positions until the minimum of 1.1155 is updated or open a long position immediately on the rebound from the support of 1.1106 based on the correction of 25-30 points within the day. The data that are expected today on the ISM index for the manufacturing sector may return the demand for the euro if they turn out to be better than forecasts of economists, as it was yesterday with the US consumer sentiment index. Such a scenario may lead to a repeated test of resistance 1.1241, fixing on which will open a direct path to the highs of 1.1286 and 1.1325, where I recommend taking the profit.
To open short positions on EURUSD, you need:
Data on the Eurozone did not lead to a sharp increase in the euro, and the lack of new buyers again pushed the euro to the week's low of 1.1193, near which the bears hastened to fix a profit. Only a repeated return to this level in the second half of the day and consolidation under it will be an additional signal to open short positions, which will finally pull the market to the side of sellers and return the pair to a downward trend. This scenario will open a direct path to the lows of 1.1170 and 1.1106, where I recommend fixing the profits. If the bulls will be stronger and the data on manufacturing activity in the US will surprise the markets, it is best to defer short positions to the formation of a false breakout on the resistance level of 1.1241 or sell EUR/USD immediately for a rebound from the week maximum in the area of 1.1286, counting on a correction of 20 -25 points inside the day.
Signals of indicators:
Moving averages
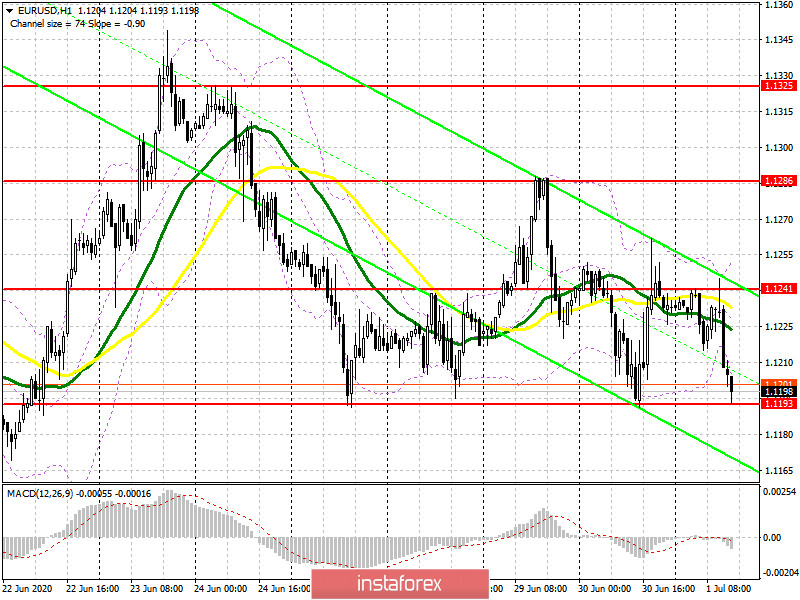
Trading is conducted below the 30 and 50 daily moving averages, which indicates that the bears are trying to return the market to their side.
Note: The period and prices of moving averages are considered by the author on the hourly chart H1 and differ from the general definition of the classic daily moving averages on the daily chart D1.
Bollinger Bands
A break in the lower border of the indicator around 1.1205 should increase pressure on the euro, while growth will be limited by the resistance of 1.1260.
Description of indicators
Le recensioni analitiche di InstaForex ti renderanno pienamente consapevole delle tendenze del mercato! Essendo un cliente InstaForex, ti viene fornito un gran numero di servizi gratuiti per il trading efficiente.


