 Rimani
Condizioni di trading
Strumenti


US government bond yields are declining and the US dollar index is making a technical correction. These data make investors take refuge in gold thus giving it the opportunity to rise and consolidate above the 200 EMA and above the 21 SMA.
Gold has a negative correlation with US government bond yields. As these bonds have been going down these days, gold has obtained positive yields reflecting the better mood of the market. The yield on 10-year Treasuries has been declining to 1.47% after testing 1.50% before opening.
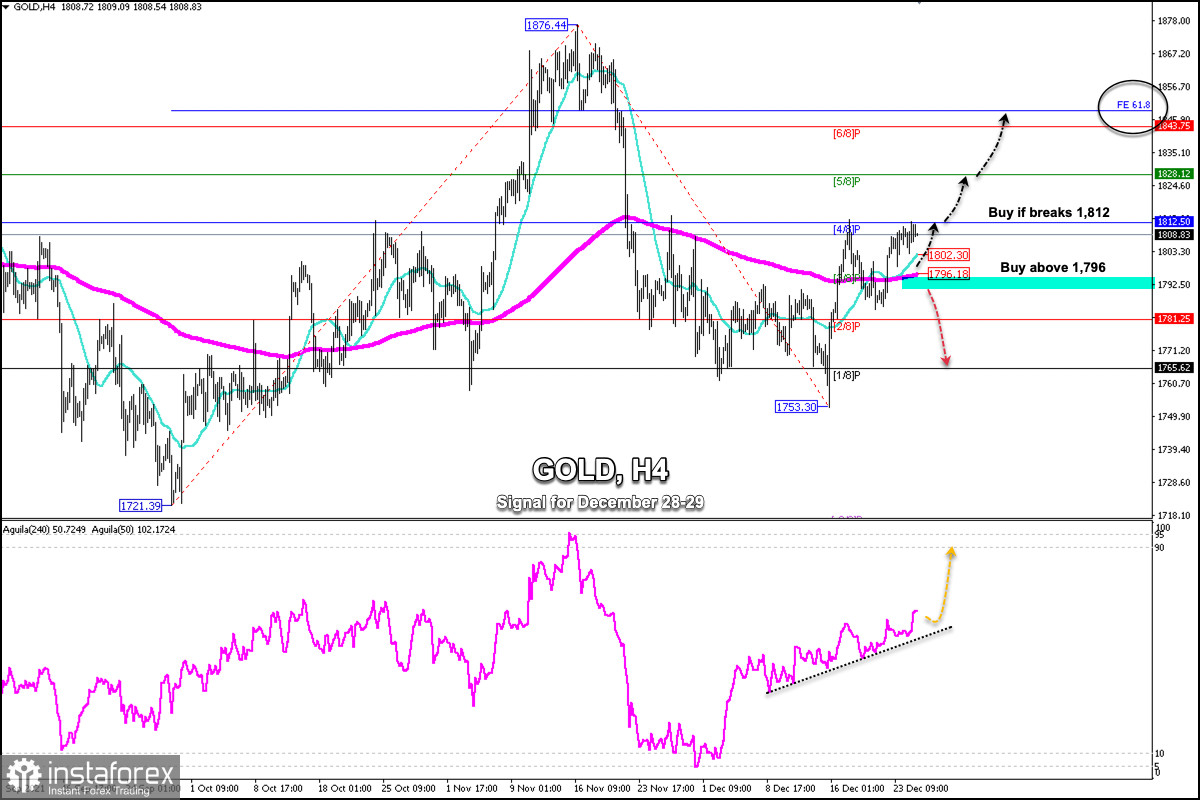
The short-term technical outlook for gold looks on the positive side. As long as it remains above the 200 EMA on the 4-hour chart it is likely that it could continue to rally to the final target at 1,850 (61.8% of Fibonacci).
The 1812 zone is acting as strong resistance. In recent days, gold has stopped its upward movement and is consolidating below this area. A sharp breakout and a consolidation on the 4-hour chart above 1,812 could accelerate the bullish move through 1,828.12 and 1,84375.
On the chart, you can see the Fibonacci expansion indicator from the low of 1,721 to the high of 1,876 which the result of this correction is located in 1,850. This level of 61.8% of Fibonacci will be the final objective if the gold is it remains above 1,796.
On the other hand, if in the next few days, the gold returns to the negative zone of 1,790 it is expected that there will be a fall until 1,781 and until 1,765.
The eagle indicator is showing a positive signal for gold moving above an uptrend channel. Any correction in the next few days towards 1,802 (21 SMA) or 1,796 (200 EMA) will be considered as an opportunity to open long positions.
Le recensioni analitiche di InstaForex ti renderanno pienamente consapevole delle tendenze del mercato! Essendo un cliente InstaForex, ti viene fornito un gran numero di servizi gratuiti per il trading efficiente.


