 Rimani
Condizioni di trading
Strumenti


Good day, dear traders!
Weekly
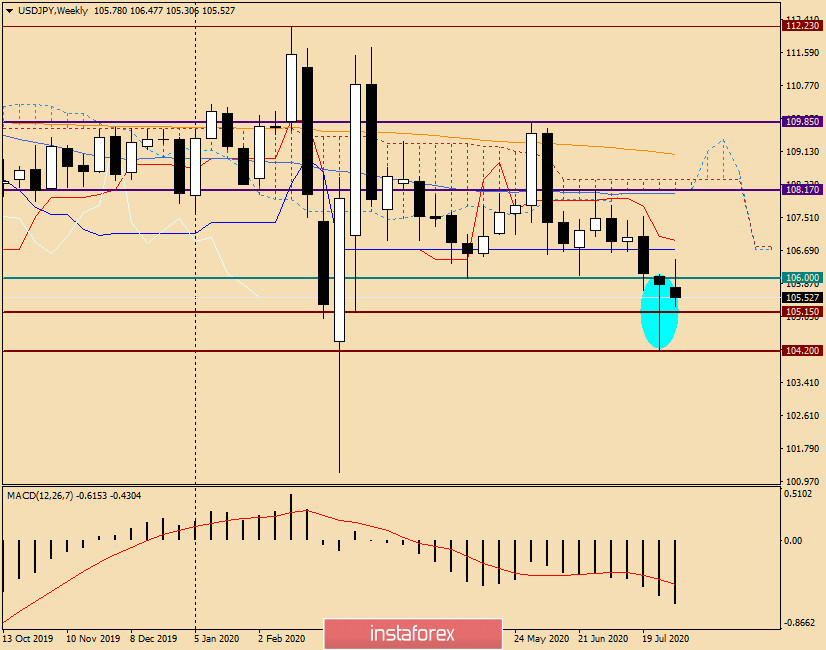
Although the last five-day trading ended under the key support level of 106.00, only one weekly candle has closed under this mark, and even then, you can see what it is. The huge lower shadow (or tail) is nothing more than a signal that the market does not want to trade for USD/JPY at lower prices and intends to return above the significant level of 106.00, the truth of the breakdown of which remains in question.
Most often, after the selected candle, which can be characterized as a reversal model of the "hammer" candle analysis, the exchange rate increases. In the current situation, everything will depend on today's data on the US labor market, which will be published at 13:30 London time. Let me remind you that it is the USD/JPY currency pair that reacts most strongly to important data from the United States of America.
To break the reversal candle of the previous week, the bears need to absorb it along with the long lower shadow, that is, break through the support level of 104.20, and close trading under this mark. If the upward scenario is implemented and the current maximum values are set at 106.48, the next target for USD/JPY bulls will be in the area of 106.70-106.95, where the Kijun and Tenkan lines of the Ichimoku indicator are located.
I would like to touch a little on the topic of the Japanese yen as a protective asset. The deal on fiscal stimulus in the United States, though slowly and creakingly, is moving to ensure that congressional Democrats find a compromise with the administration of Donald Trump, and the plan was still adopted. Another important point for the Japanese currency. Increased demand for the yen is noticeably stronger during the period of falling stock markets. In such situations, investors go to safe havens, one of which is the Japanese yen. At the moment, the stock market is relatively stable, so there is no acceleration of flight from risks yet.
From a technical point of view, do not write off the iconic psychological and technical level of 105 yen per dollar. The chart clearly shows what happened after a short-term flight of the price below this significant mark. Very strong demand!
Daily
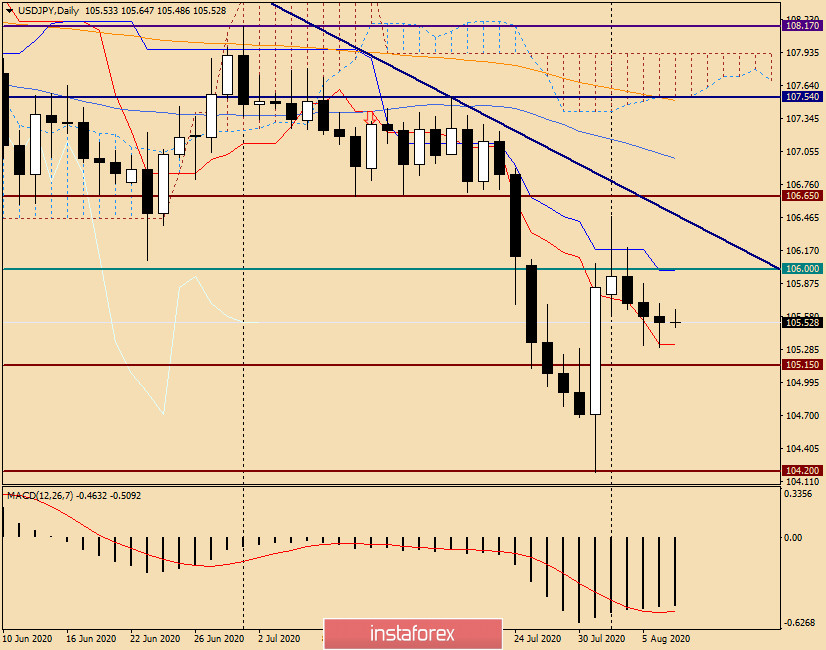
On the daily chart, everything is relatively calm, and market participants prefer not to make sudden movements but wait for data on labor from the United States. At the time of writing this article, the Tenkan line supports the quote, but it will be clear whether it will hold the price or breakthrough after 13:30 London time. Today, the goals at the top are in the price area of 106.00-106.65, and the benchmark for sellers will be the area of 105.00-104.20.
The situation is quite difficult for making trading decisions. Especially considering today's Nonfarm. However, taking into account the latest candlestick pattern on the weekly chart, I would venture to assume that the market will implement an ascending scenario. For those who agree with this point of view, I recommend that you consider buying on the declines to 105.35, 105.00, and 104.80.
At the same time, we can not exclude an alternative scenario and successful sales from the price area of 106.00-106.30, especially if there are reversal patterns of Japanese candles on the four-hour and (or) hourly charts.
Good luck!
Le recensioni analitiche di InstaForex ti renderanno pienamente consapevole delle tendenze del mercato! Essendo un cliente InstaForex, ti viene fornito un gran numero di servizi gratuiti per il trading efficiente.

