 Rimani
Condizioni di trading
Strumenti


Trend analysis (Fig. 1).
The market may move downward from the level of 1.3074 (closing of yesterday's daily candle) with the target of 1.2966 - a 23.6% pullback level (red dotted line). In case of reaching this level, the downward trend may continue with the next target of 1.2828 - a 38.2% pullback level (red dotted line).
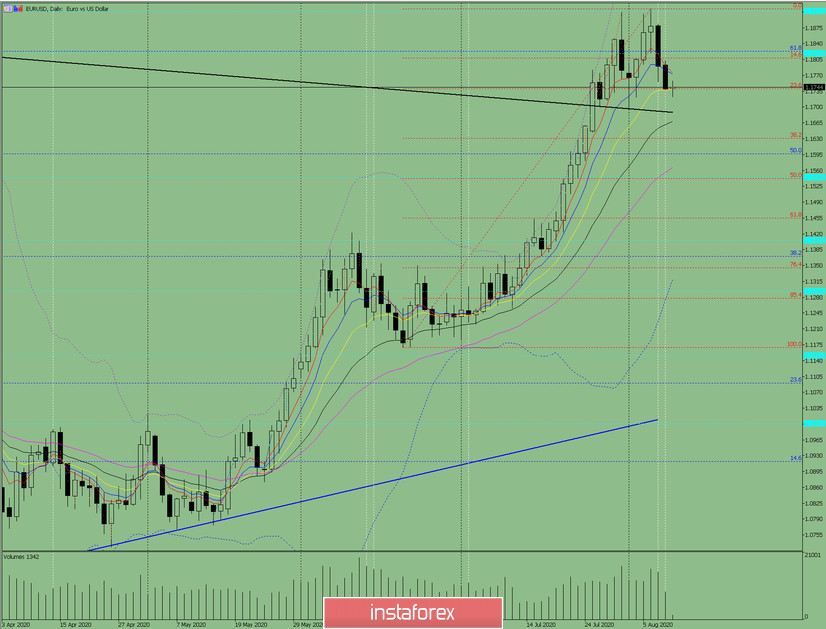
Fig. 1 (daily chart).
Comprehensive analysis:
- Indicator analysis - down;
- Fibonacci levels - down;
- Volumes - down;
- Candlestick analysis - down;
- Trend analysis - down;
- Bollinger lines - down;
- Weekly chart - down.
General conclusion:
Today the price may move downward from the level of 1.3074 (closing of yesterday's daily candle) with the target at 1.2966 - a 23.6% pullback level (red dotted line). In case of reaching this level, the downward trend may continue with the next target of 1.2828 - a 38.2% pullback level (red dotted line).
Another possible scenario is from the level of 1.3074 (closing of yesterday's daily candle), the price may continue to move downward with the target at the support level of 1.2961 (black bold line). In case of testing this line, the price may begin to move upwards with the target of 1.3160 - a 161.8% target level (blue dashed line).
Le recensioni analitiche di InstaForex ti renderanno pienamente consapevole delle tendenze del mercato! Essendo un cliente InstaForex, ti viene fornito un gran numero di servizi gratuiti per il trading efficiente.

