 Rimani
Condizioni di trading
Strumenti


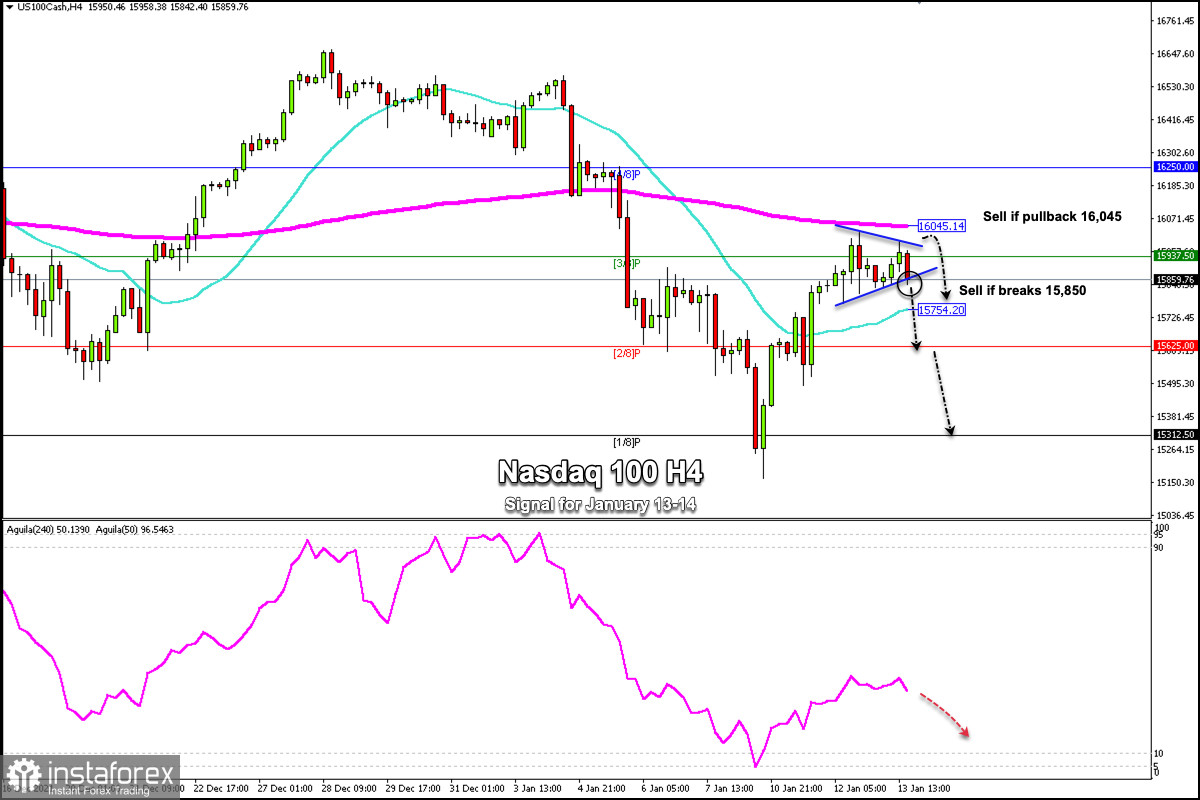
From its low of 15,162, the Nasdaq 100 technology index (#NDX) has managed to reach the top of the 200 EMA located at 16,045. Right now, it is consolidating and forming a pattern of a symmetrical triangle. A break below this pattern could be the start of a bearish move towards 2/8 Murray (15.625) and towards the support 1/8 around 15,312.
On the other hand, a pullback towards the 200 EMA around 16.045 will be an opportunity to sell, only if the price falls below this zone.
As the Fed confirmed its agenda for raising interets rates this year, this outlook could weaken the Nasdaq 100 index and we could expect its drop towards the psychological level of 15,000 points.
According to the daily chart, the main trend of NDX is still bearish. According to the 4-hour chart, we also notice a downtrend. Given that it is trading below the 200 EMA, this bounce will be considered a technical correction to give us the opportunity to sell in the next few days with targets at 15,160.
A consolidation in daily charts above the psychological level of 16,000 points will be the beginning of a bullish movement and we could expect the index to reach the all-time high of 16,767.
As long as it remains trading below 4/8 Murray located at 16,250, the Nasdaq will struggle for a new uptrend. Therefore, if in the next days it approaches this area, it will give us an opportunity to continue selling and expect a sustained decline in the medium term.
Support and Resistance Levels for January 13 - 14, 2022
Resistance (3) 16,250
Resistance (2) 16,146
Resistance (1) 15,937
----------------------------
Support (1) 15,780
Support (2) 15,625
Support (3) 15,533
***********************************************************
Scenario
Timeframe H4
Recommendation: sell if breaks
Entry Point 15,850
Take Profit 15,754 (21 SMA), 15,625 (2/8) 15,312 (1/8).
Stop Loss 15,930
Murray Levels 16,250 (4/8) 15,937 (3/8) 15,625 (2/8) 15,312 (1/8)
***********************************************************
Le recensioni analitiche di InstaForex ti renderanno pienamente consapevole delle tendenze del mercato! Essendo un cliente InstaForex, ti viene fornito un gran numero di servizi gratuiti per il trading efficiente.


