 Rimani
Condizioni di trading
Strumenti


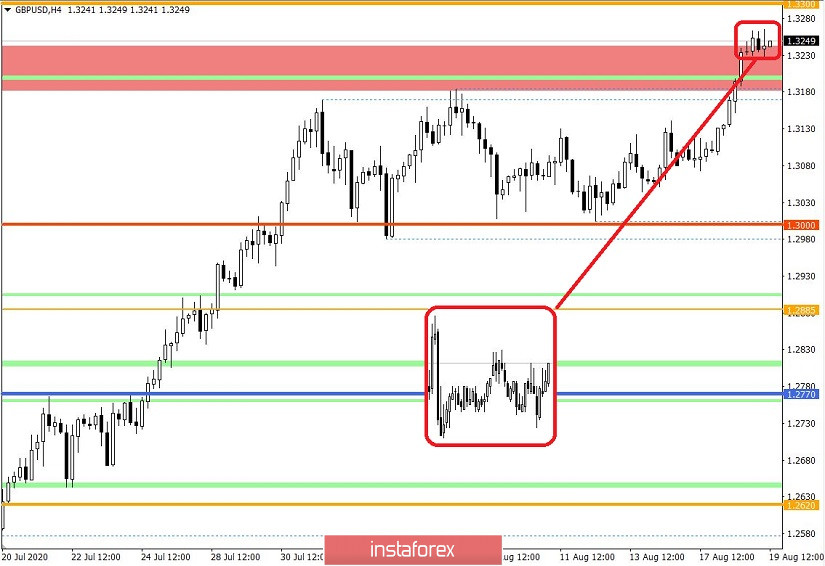
The GBP / USD rate passed the local high, thereby breaking the upper limit of the sideways channel. It brought the quote to the price level reached in December 2019, leaving behind the collapse observed this March. However, such a rapid recovery in the pound alarms market participants, mainly because the foundation of the growth is very uncertain and unstable, in which as soon as the sale of the US dollar is over, everything can change rather quickly.
Nonetheless, movement within the range 1.2770 // 1.3000 // 1.3300 is still relevant, and the recent breakdown of the flat has accelerated the process of reaching the second level. Activity at the level of 1.3300 should be increased, as the absence of interaction may raise even greater speculative interest, which may lead to a movement towards the 2019 high located at 1.3513.
Thus, analyzing the last trading day by minutes (M30), we can see that the movement, or lac thereof, last August 17 accumulated speculative interest, due to which a local inertial move arose, which led to the renewal of local high and breakout from the flat.
It gave volatility of about 157 points, which is 234% higher than the dynamics the previous day.
In addition, as discussed in the previous review , traders adhered to the strategy of breaking out from the limits, and it brought quite good profit.
As for the daily chart, we can see a signal for an upcoming acceleration, and this is indicated by a series of Doji candles in the chart.

News published yesterday included data on construction in the United States, with which new homes increased by 22.6% in July compared to the revised figure in June, amounting to 1,496,000. At the same time, issued building permits rose by 18.8% this July, and to 1,495,000.
Unfortunately, such a positive dynamics was ignored by the market, and the USD continued to decline in the trading chart.
Today, data in UK inflation was released, and according to the report, it rose to its highest level since March, fueled by rising prices for goods, clothing, and fuel. Thus, inflation accelerated from 0.6% to 1.0% in annual terms, and rose from 0.1% to 0.4% in monthly terms.
The latest Fed protocol is also scheduled to be released today, and it may give some idea of how the regulator sees the course of the US 'economic recovery.
Further development
Analyzing the current trading chart, we can see the low-amplitude fluctuation within the range 1.3230 / 1.3265, which probably reflects the withdrawal of profits from the past rally.
The absence of a reversal indicates that there are still plenty of long positions in the market, and if the price consolidates above the level of 1.3265, an increase towards the level of 1.3300 could occur.
At the same time, the slowdown within the range gives traders the opportunity to be on the wave of yet another speculation, working on a breakout of the set limits.
Thus,
- Buy positions if the quote consolidates above 1.3265, in the direction of the price level 1.3300.
- Meanwhile, sell positions if the quote consolidates below 1.3220, in the direction od the price level 1.3180.
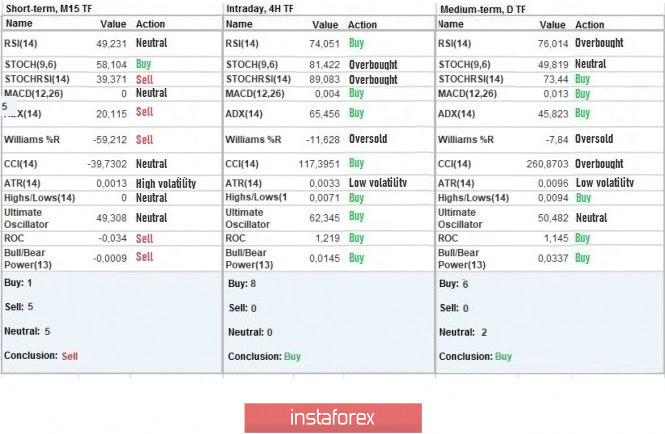
Indicator analysis
Analyzing the different sectors of time frames (TF), we can see that the indicators of the minute period contain mixed signals due to the fluctuations. Meanwhile, the hourly and daily periods, on the other hand, signal buy due to the update of the local high, as well as breakdown of the flat pattern.
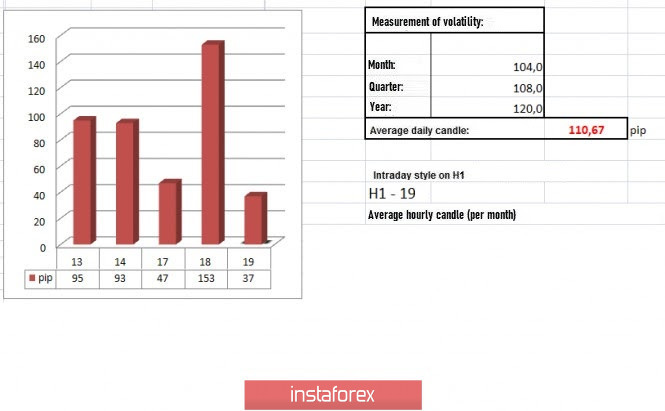
Weekly volatility / Volatility measurement: Month; Quarter; Year
The measurement of volatility reflects the average daily fluctuations, calculated per Month / Quarter / Year.
(August 19's was built, taking into account the time this article is published)
Volatility is currently 37 points, which is 66% below the average daily value. The exit of quotes from the range of 1.3230 / 1.3265 will automatically lead to an acceleration in volatility.
Key levels
Resistance zones: 1.3300 **; 1.3600; 1.3850; 1.4000 ***; 1.4350 **.
Support zones: 1.3200; 1.3000; 1.2885 *; 1.2770 **; 1.2620; 1.2500; 1.2350 **; 1.2250; 1.2150 **; 1.2000 ***.
* Periodic level
** Range level
*** Psychological level
Also check the trading recommendations for the EUR / USD pair here , or the brief trading recommendations for the EUR / USD and GBP / USD pairs here .
Le recensioni analitiche di InstaForex ti renderanno pienamente consapevole delle tendenze del mercato! Essendo un cliente InstaForex, ti viene fornito un gran numero di servizi gratuiti per il trading efficiente.


