 Rimani
Condizioni di trading
Strumenti


Trend analysis.
This week, the price from the level of 1.3089 (the close of the last weekly candle) will move upwards in order to reach the pullback level of 85.4% - 1.3205 (blue dashed line). If this line is reached, it is possible to continue working upwards with the target of 1.3298 - the historical resistance level (blue thin line).
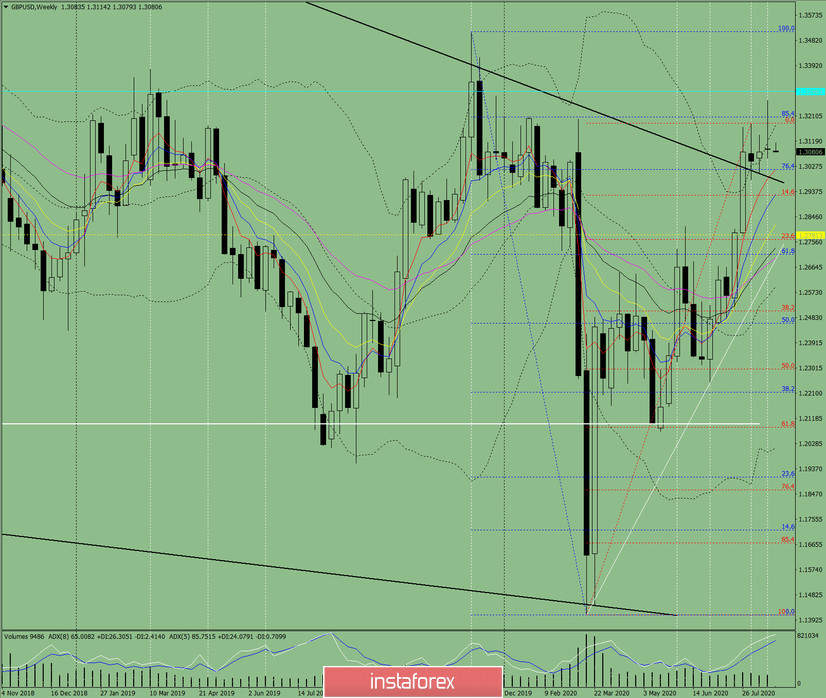
Figure: 1 (weekly chart).
Comprehensive analysis:
- indicator analysis - up;
- Fibonacci levels - up;
- volumes - up;
- candlestick analysis - down;
- trend analysis - up;
- Bollinger lines - up;
- monthly chart - up.
An upward movement can be concluded based on a comprehensive analysis.
The general result of calculating the candlestick of the GBP/USD currency pair according to the weekly chart: the price of the week is likely to have an upward trend with the absence of the first lower shadow of the weekly white candlestick (Monday - up) and the absence of the second upper shadow (Friday - up).
The first upper target is the 85.4% pullback level - 1.3205 (blue dotted line). If this line is reached, it is possible to continue working upwards with the target of 1.3298 - the historical resistance level (blue thin line).
An unlikely scenario: from the level of 1.3089 (closing of the last weekly candle), it will decline in order to reach the support line 1.2981 (black bold line). Upon reaching this line, work upwards with the target of the pullback level 85.4% - 1.3205 (blue dotted line).
Le recensioni analitiche di InstaForex ti renderanno pienamente consapevole delle tendenze del mercato! Essendo un cliente InstaForex, ti viene fornito un gran numero di servizi gratuiti per il trading efficiente.


